Fig. 1
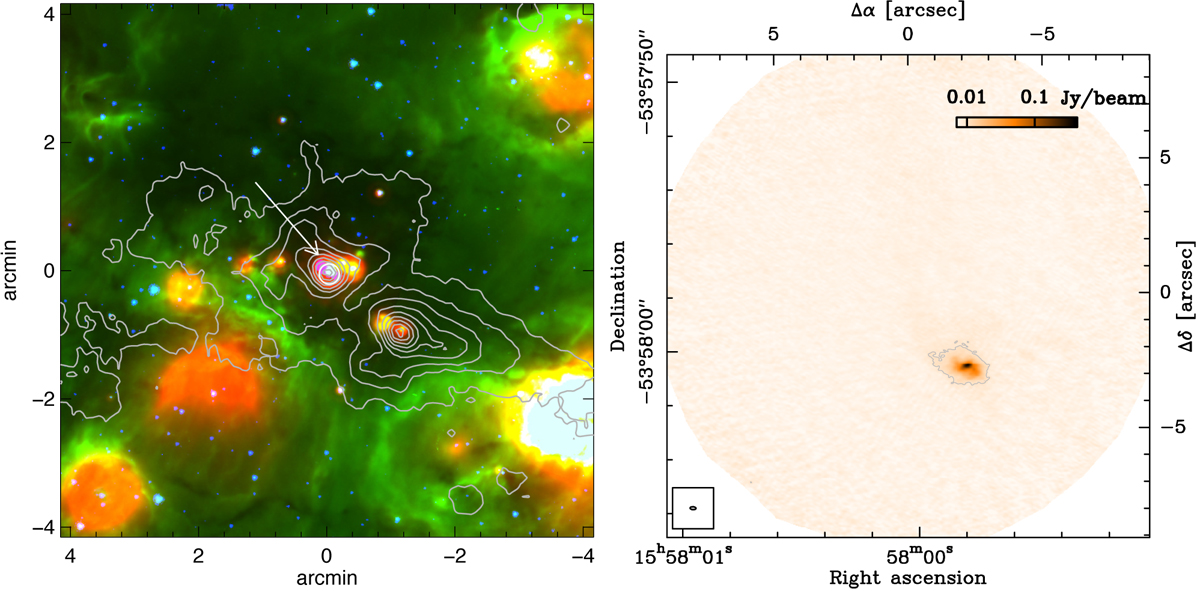
Overview of the region centred on ℓ = +328.2551, b = −0.5321 in Galactic coordinates. Left panel: the three-colour composite image is from the Spitzer/GLIMPSE (Benjamin et al. 2003) and MIPSGAL (Carey et al. 2009) surveys (blue: 4.5 μm, green: 8 μm, and red: 24 μm) and is shownin Galactic coordinates. The contours show the 870 μm continuum emission from the ATLASGAL survey (Schuller et al. 2009; Csengeri et al. 2014). The arrow marks the dust continuum peak of the targeted clump, and the circle corresponds to the region shown in the right panel. Right panel: line-free continuum emission imaged at 345 GHz with the ALMA 12 m array. The colour scale is linear from − 3σ to 120σ. The contour shows the 7σ level. The FWHM size of the synthesised beam is shown in the lower left corner.
Current usage metrics show cumulative count of Article Views (full-text article views including HTML views, PDF and ePub downloads, according to the available data) and Abstracts Views on Vision4Press platform.
Data correspond to usage on the plateform after 2015. The current usage metrics is available 48-96 hours after online publication and is updated daily on week days.
Initial download of the metrics may take a while.