Fig. 6
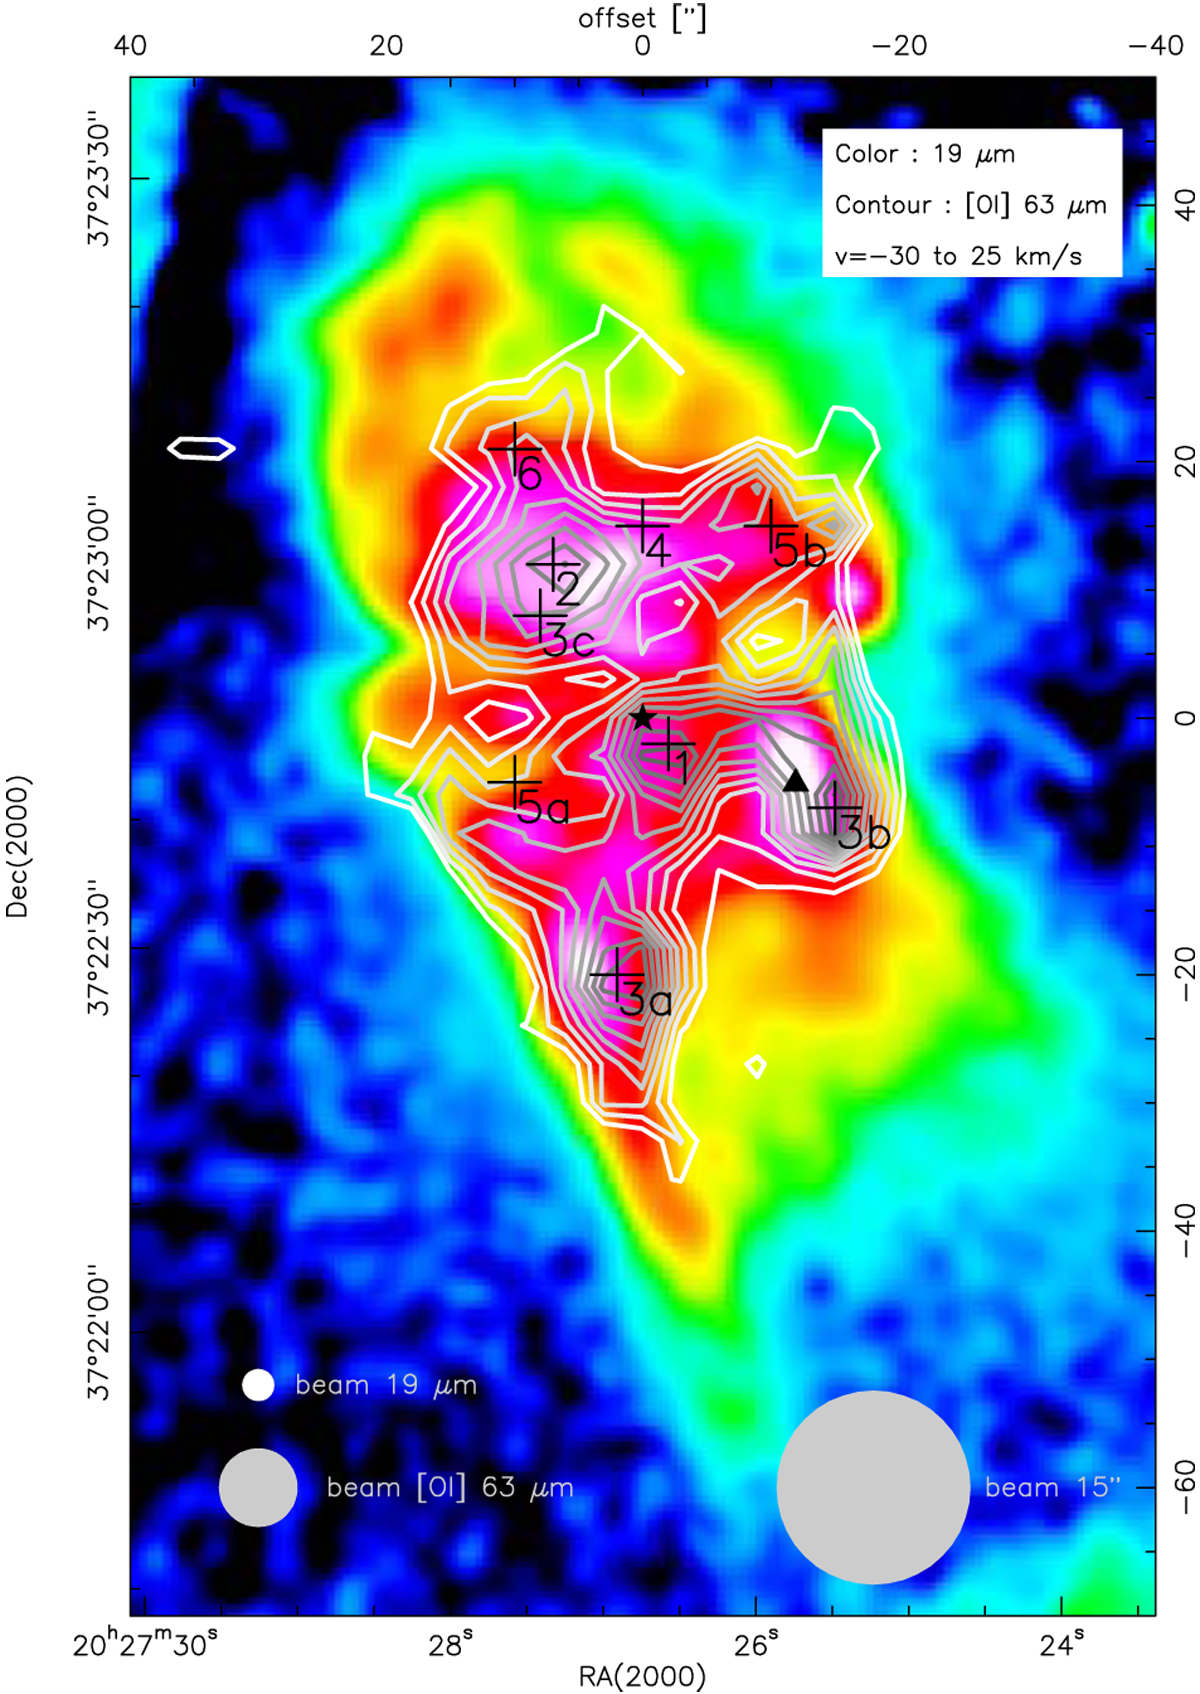
[O I] emission of the total velocity range from –30 to 25 km s−1 in contours overlaid on a map of 19 μm emission (FORCAST; Adams et al. 2015). Positions for which we show individual spectra of various lines and report the line integrated intensities in Table 2 (in a 15″ beam) are indicated with a cross and labelled 1–6. The angular resolution of the 19 μm emissionand the [O I] beam are indicated in the panel. For comparison, the 15″ resolution we used for PDR modelling is also given. Positions 1–6 do not always correspond to peaks in [O I] emission, but also to peak emission in high- and low-J CO lines (see text for details).
Current usage metrics show cumulative count of Article Views (full-text article views including HTML views, PDF and ePub downloads, according to the available data) and Abstracts Views on Vision4Press platform.
Data correspond to usage on the plateform after 2015. The current usage metrics is available 48-96 hours after online publication and is updated daily on week days.
Initial download of the metrics may take a while.