Fig. 15
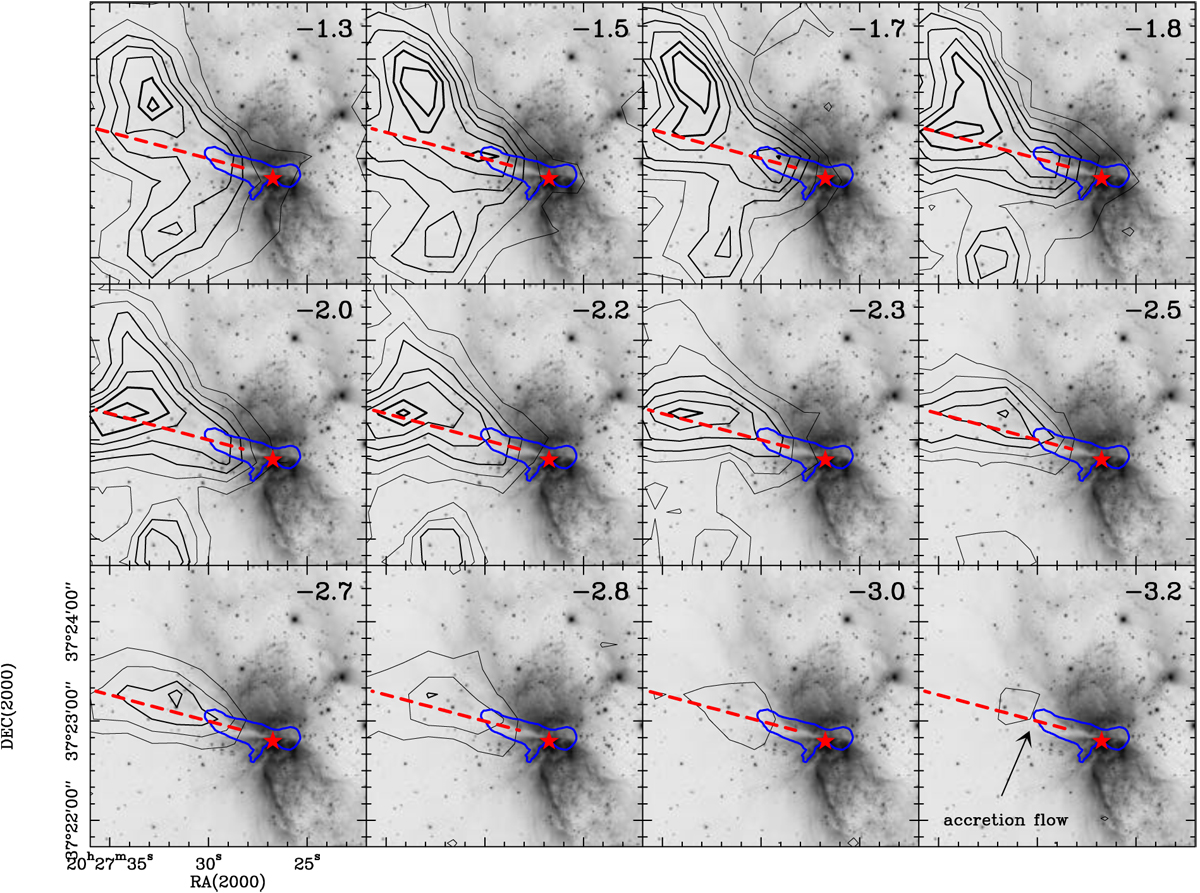
Channel map of H13CO+ 1 →0 emission (contours in K km s−1 from 0.25 to 1.75 in steps of 0.25) obtained with the IRAM 30 m telescope. The background image is the Subaru IR image from Fig 1. The blue contour is the 3 Jy level of the SHARC 350 μm emission. The star marks the position of the binary system S106 IR; the dashed red line indicates the run of the dark lane, i.e. thepossible accretion flow.
Current usage metrics show cumulative count of Article Views (full-text article views including HTML views, PDF and ePub downloads, according to the available data) and Abstracts Views on Vision4Press platform.
Data correspond to usage on the plateform after 2015. The current usage metrics is available 48-96 hours after online publication and is updated daily on week days.
Initial download of the metrics may take a while.