Fig. 12
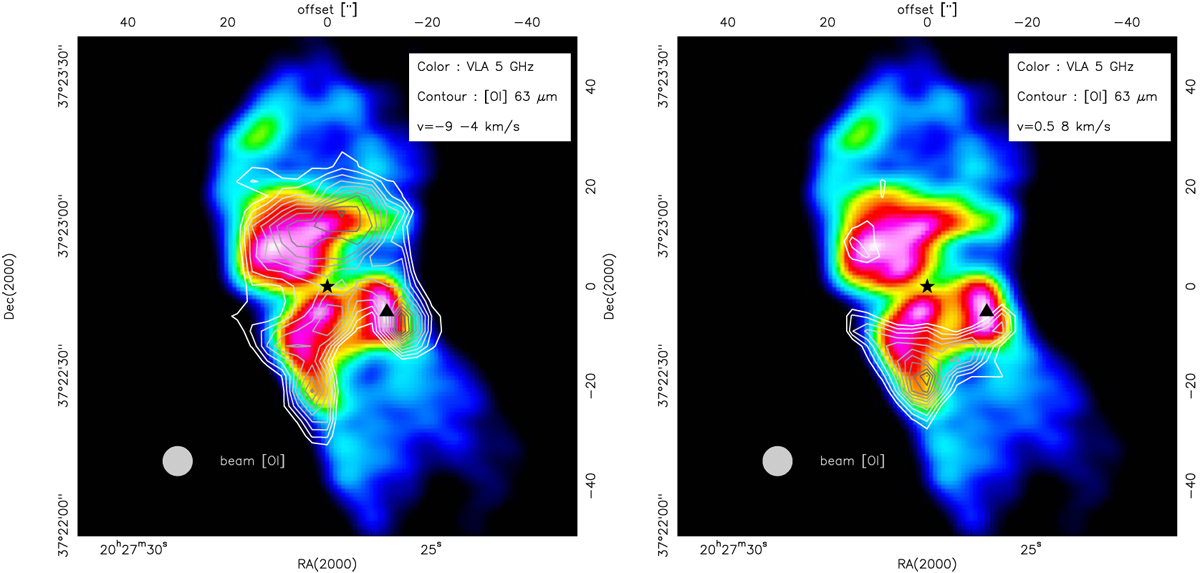
[O I] line integrated emission overlayed as contours on cm emission from the VLA (Bally et al. 1983). The left panel shows the blue outflow range and the right panel the redemission. The [O I] contour lines go from 36 to 156 in steps of 10 K km s−1 for the blue outflow and 40 to 180 in steps of 10 K km s−1 for the red outflow. The star indicates the binary system S106 IR and the triangle S106 FIR.
Current usage metrics show cumulative count of Article Views (full-text article views including HTML views, PDF and ePub downloads, according to the available data) and Abstracts Views on Vision4Press platform.
Data correspond to usage on the plateform after 2015. The current usage metrics is available 48-96 hours after online publication and is updated daily on week days.
Initial download of the metrics may take a while.