Fig. 11
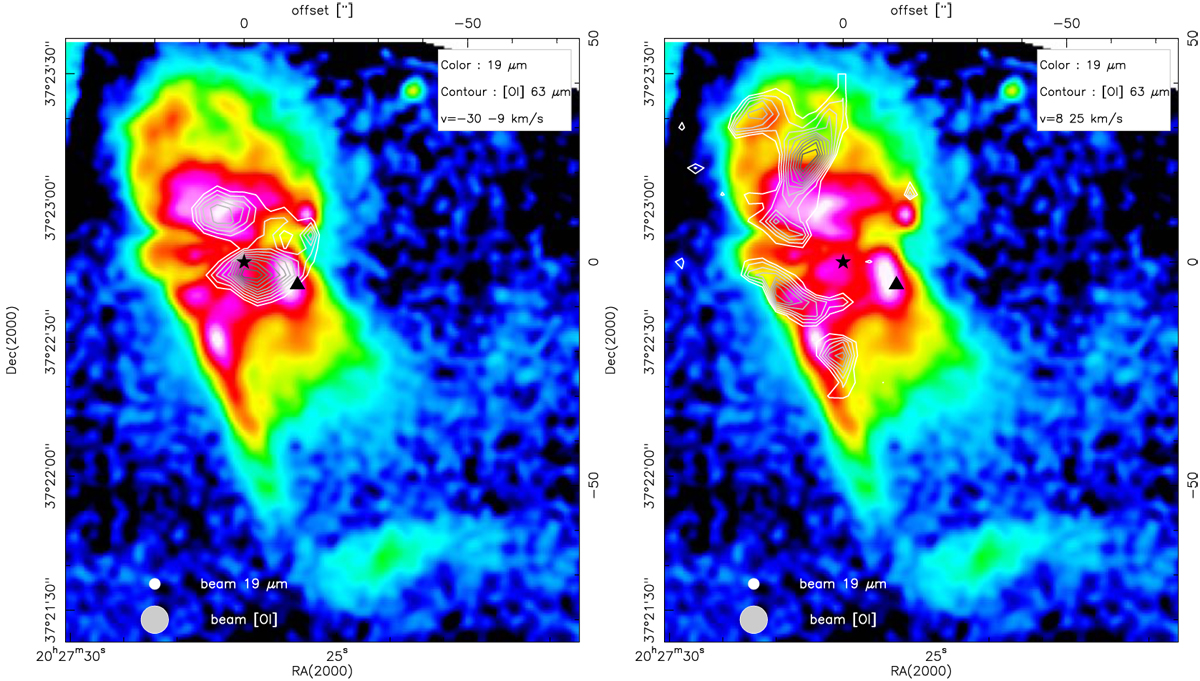
[O I] line integrated emission overlayed as contours on 19 μm emission from dust (Adams et al. 2015). The left panel shows the high-velocity blue emission and the right panel the high-velocity red emission. The dust emission ranges between 0 and 2.6 Jy pix−1, the [O I] contour lines go from 30 to 100% of maximum intensity (397 K km s−1 for HV-blue and 121 K km s−1 for HV-red).
Current usage metrics show cumulative count of Article Views (full-text article views including HTML views, PDF and ePub downloads, according to the available data) and Abstracts Views on Vision4Press platform.
Data correspond to usage on the plateform after 2015. The current usage metrics is available 48-96 hours after online publication and is updated daily on week days.
Initial download of the metrics may take a while.