Fig. 9
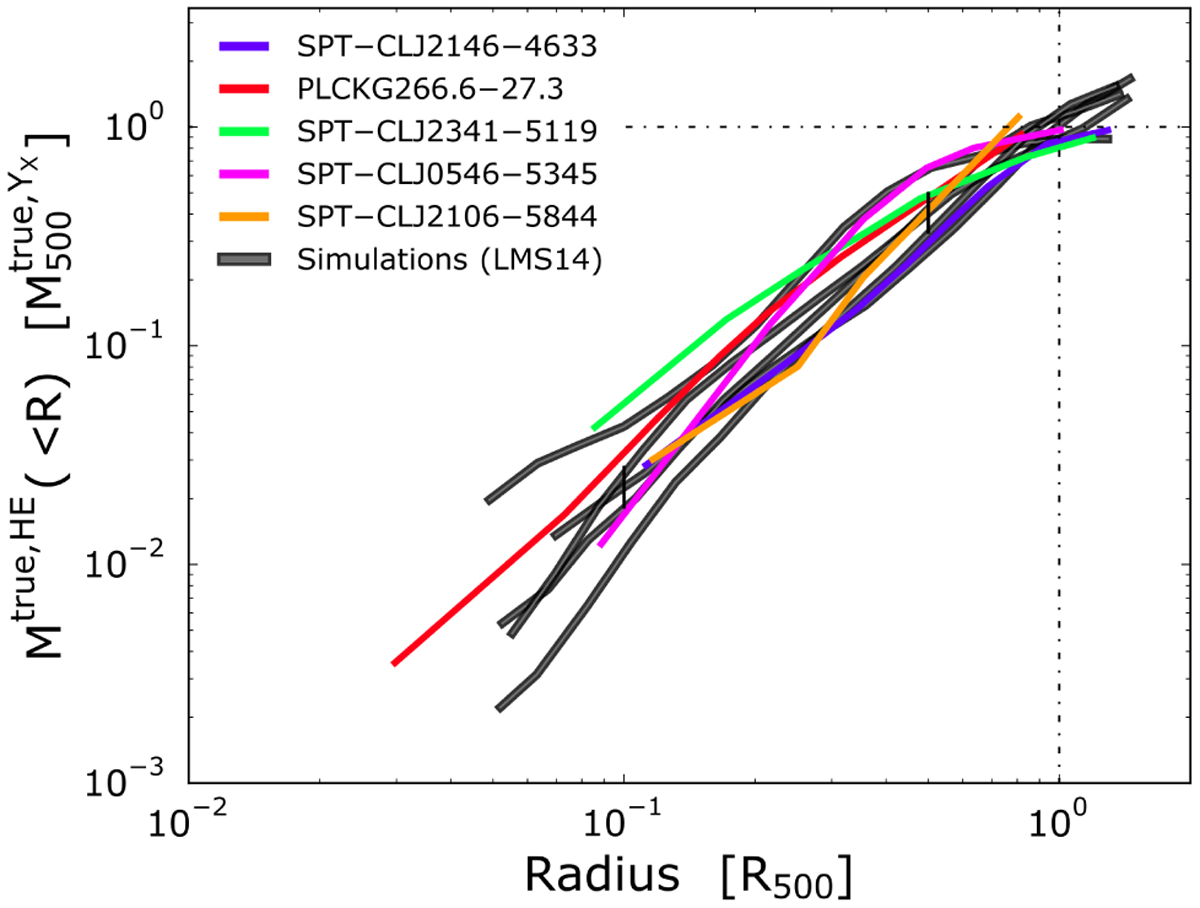
Scaled hydrostatic mass profiles derived in this work and from the suite of cosmological simulations published in Le Brun et al. (2014), shown with coloured and grey solid lines. The black error bars represent the 68% dispersion of the simulated profiles computed at 0.1 and 0.5 ![]() . Simulated and X-ray mass profiles were scaled by their
. Simulated and X-ray mass profiles were scaled by their ![]() and
and ![]() , respectively. Our sample and simulated cluster radial profiles were scaled by their
, respectively. Our sample and simulated cluster radial profiles were scaled by their ![]() and
and ![]() , respectively. The common scaled radius is indicated with R500.
, respectively. The common scaled radius is indicated with R500.
Current usage metrics show cumulative count of Article Views (full-text article views including HTML views, PDF and ePub downloads, according to the available data) and Abstracts Views on Vision4Press platform.
Data correspond to usage on the plateform after 2015. The current usage metrics is available 48-96 hours after online publication and is updated daily on week days.
Initial download of the metrics may take a while.