Fig. 8
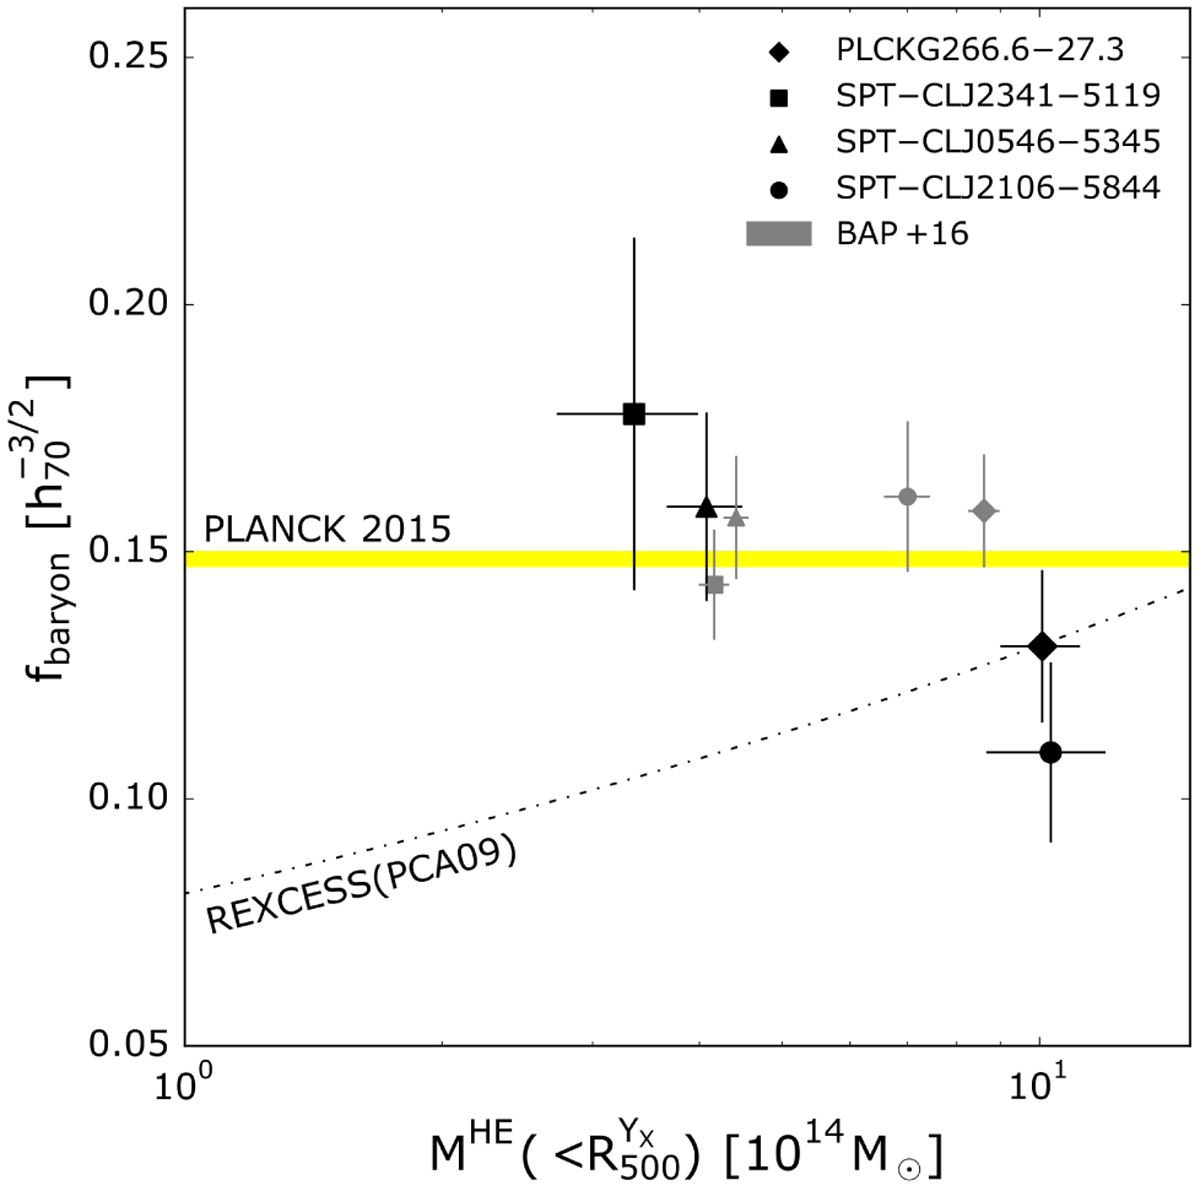
Baryon fractions computed at ![]() as a function of mass. The baryon fraction does not show any dependence with respect to the mass at this high z. Black points represent the baryon fraction computed using the hydrostatic mass profiles at
as a function of mass. The baryon fraction does not show any dependence with respect to the mass at this high z. Black points represent the baryon fraction computed using the hydrostatic mass profiles at ![]() . The grey points represent the baryon fractions published in Bartalucci et al. (2017), computed using the
. The grey points represent the baryon fractions published in Bartalucci et al. (2017), computed using the ![]() . Gas masses were computed using the gas mass profiles derived from the combined density profiles. We used the stellar masses published in Chiu et al. (2016); stellar mass for SPT–CL J2146–4633 is not available. The yellow shaded area represents the baryon fraction published in Planck Collaboration XIII (2016).
. Gas masses were computed using the gas mass profiles derived from the combined density profiles. We used the stellar masses published in Chiu et al. (2016); stellar mass for SPT–CL J2146–4633 is not available. The yellow shaded area represents the baryon fraction published in Planck Collaboration XIII (2016).
Current usage metrics show cumulative count of Article Views (full-text article views including HTML views, PDF and ePub downloads, according to the available data) and Abstracts Views on Vision4Press platform.
Data correspond to usage on the plateform after 2015. The current usage metrics is available 48-96 hours after online publication and is updated daily on week days.
Initial download of the metrics may take a while.