Fig. 5
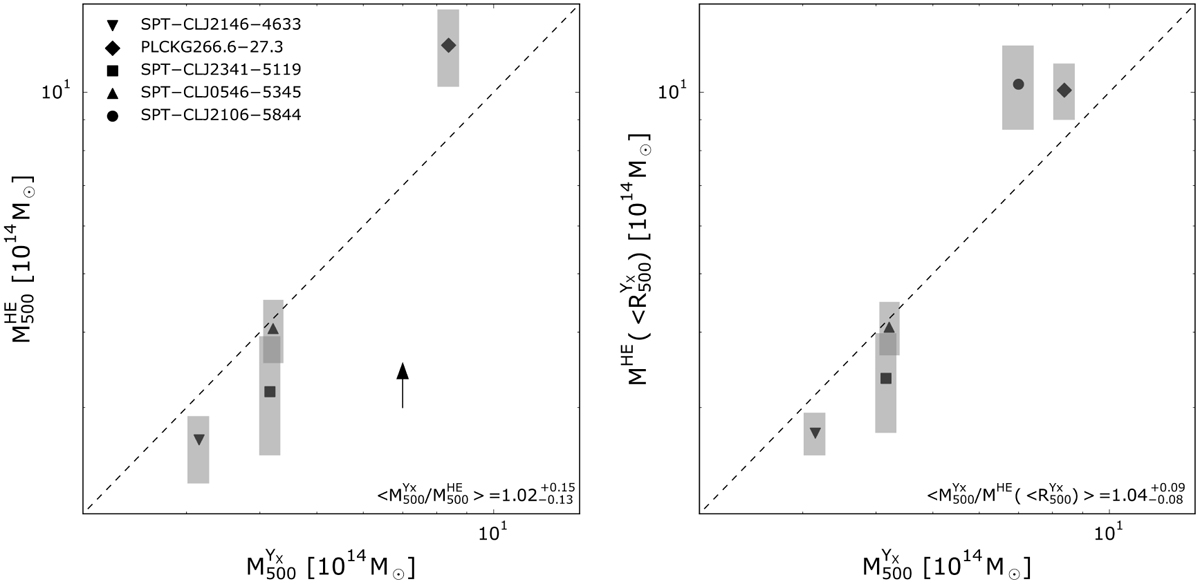
Left panel: comparison between ![]() computed iteratively through the M500−YX relation and the hydrostatic mass,
computed iteratively through the M500−YX relation and the hydrostatic mass, ![]() . The estimates are consistent within the statistical errors. The
. The estimates are consistent within the statistical errors. The ![]() of SPT‒CL J2106‒5844 is ∼3.5 greater than
of SPT‒CL J2106‒5844 is ∼3.5 greater than ![]() (see Sect. 2.4.2). For this reason, the point is off the scale and its
(see Sect. 2.4.2). For this reason, the point is off the scale and its ![]() is instead shown with the black arrow. The black dotted line is the 1 : 1 relation. Right panel: same as the left panel, except showing the comparison between
is instead shown with the black arrow. The black dotted line is the 1 : 1 relation. Right panel: same as the left panel, except showing the comparison between ![]() and
and ![]() . Error–weighted mean ratio and corresponding errors are reported in each panel.
. Error–weighted mean ratio and corresponding errors are reported in each panel.
Current usage metrics show cumulative count of Article Views (full-text article views including HTML views, PDF and ePub downloads, according to the available data) and Abstracts Views on Vision4Press platform.
Data correspond to usage on the plateform after 2015. The current usage metrics is available 48-96 hours after online publication and is updated daily on week days.
Initial download of the metrics may take a while.