Fig. 4
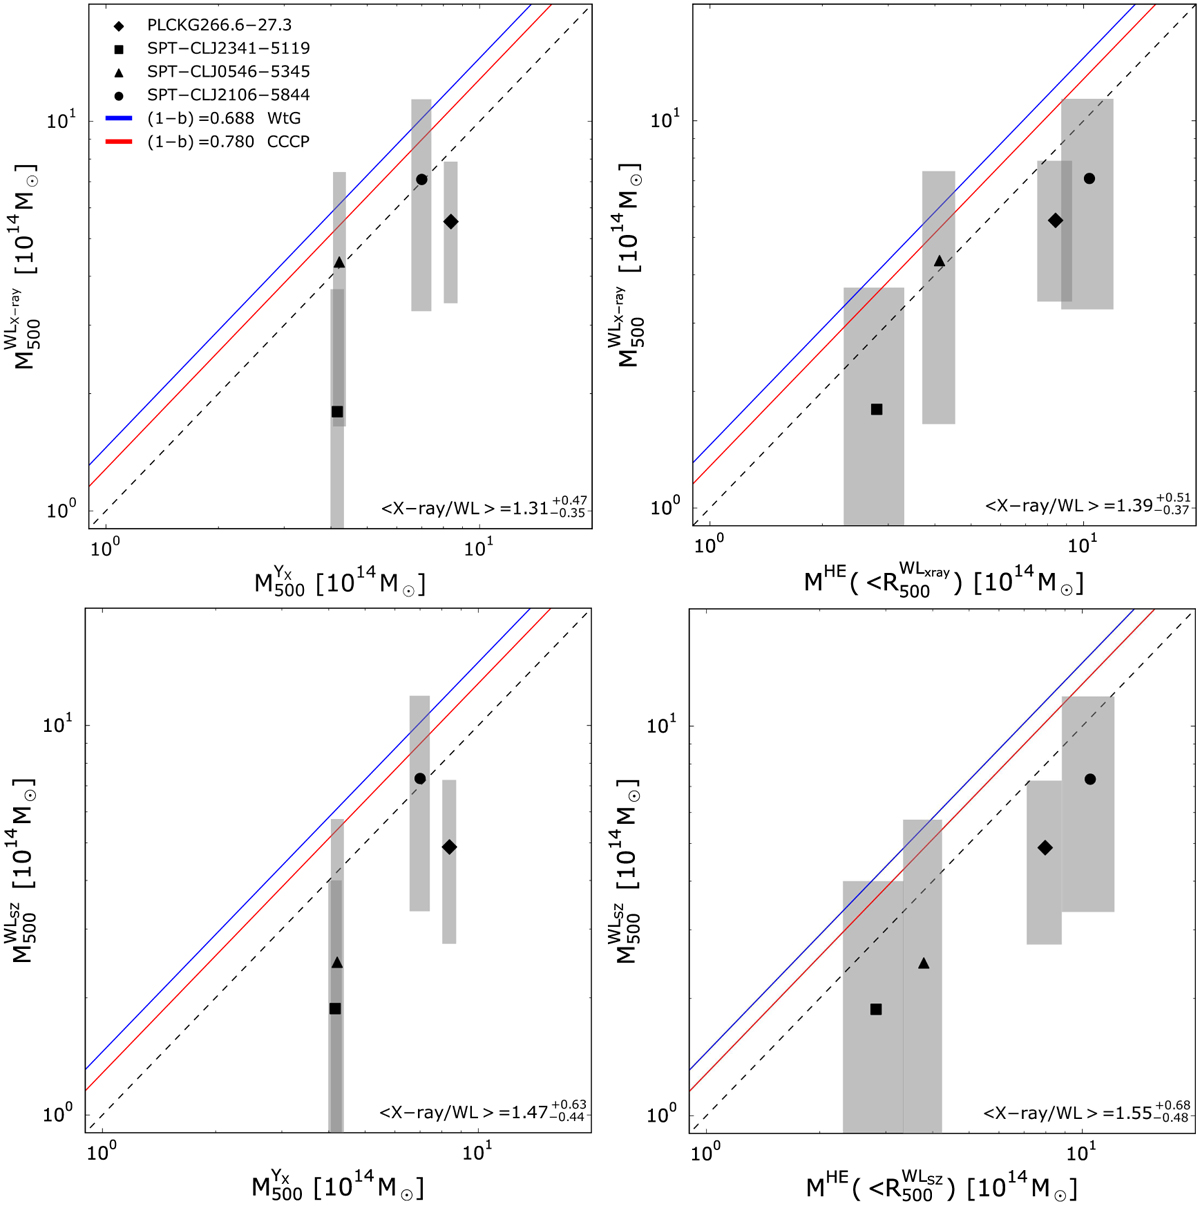
Comparison between our X-ray masses and the weak lensing masses published in Schrabback et al. (2018). All estimates for a given cluster are consistent within the statistical errors. However, there is a general trend of smaller lensing mass than the HE mass, contrary to expectation. Note also the higher statistical precision of the X-ray masses. Top left panel: comparison between ![]() and weak lensing masses estimated at R500, centred on the X-ray peak. The grey area for the weak lensing represents the statistical errors. The black solid bars represent the sum in quadrature of systematic and statistical errors. The blue and red lines represent the bias, (1 − b), between the X-ray hydrostatic and weak lensing mass as measured by Weighting the Giants (WtG, von der Linden et al. 2014) and by the Canadian Cluster Comparison Project (CCCP, Hoekstra et al. 2015), respectively. To better visualise the points, we crop the lower values of SPT-CLJ2341-5119 and SPT-CLJ0546-5345, which are of the order of ∼10−1 × 10¹⁴ M⊙. Top right panel: same as the top left panel, except showing the comparison between the hydrostatic mass computed at
and weak lensing masses estimated at R500, centred on the X-ray peak. The grey area for the weak lensing represents the statistical errors. The black solid bars represent the sum in quadrature of systematic and statistical errors. The blue and red lines represent the bias, (1 − b), between the X-ray hydrostatic and weak lensing mass as measured by Weighting the Giants (WtG, von der Linden et al. 2014) and by the Canadian Cluster Comparison Project (CCCP, Hoekstra et al. 2015), respectively. To better visualise the points, we crop the lower values of SPT-CLJ2341-5119 and SPT-CLJ0546-5345, which are of the order of ∼10−1 × 10¹⁴ M⊙. Top right panel: same as the top left panel, except showing the comparison between the hydrostatic mass computed at ![]() ,
, ![]() , and the weak lensing masses. Bottom left and right panels: same as the top panels except that weak lensing masses are computed using the Sunyavez-Zeldovich (SZ) peak as the centre. The error–weighted mean ratio and corresponding errors are reported in each panel.
, and the weak lensing masses. Bottom left and right panels: same as the top panels except that weak lensing masses are computed using the Sunyavez-Zeldovich (SZ) peak as the centre. The error–weighted mean ratio and corresponding errors are reported in each panel.
Current usage metrics show cumulative count of Article Views (full-text article views including HTML views, PDF and ePub downloads, according to the available data) and Abstracts Views on Vision4Press platform.
Data correspond to usage on the plateform after 2015. The current usage metrics is available 48-96 hours after online publication and is updated daily on week days.
Initial download of the metrics may take a while.