Fig. C1
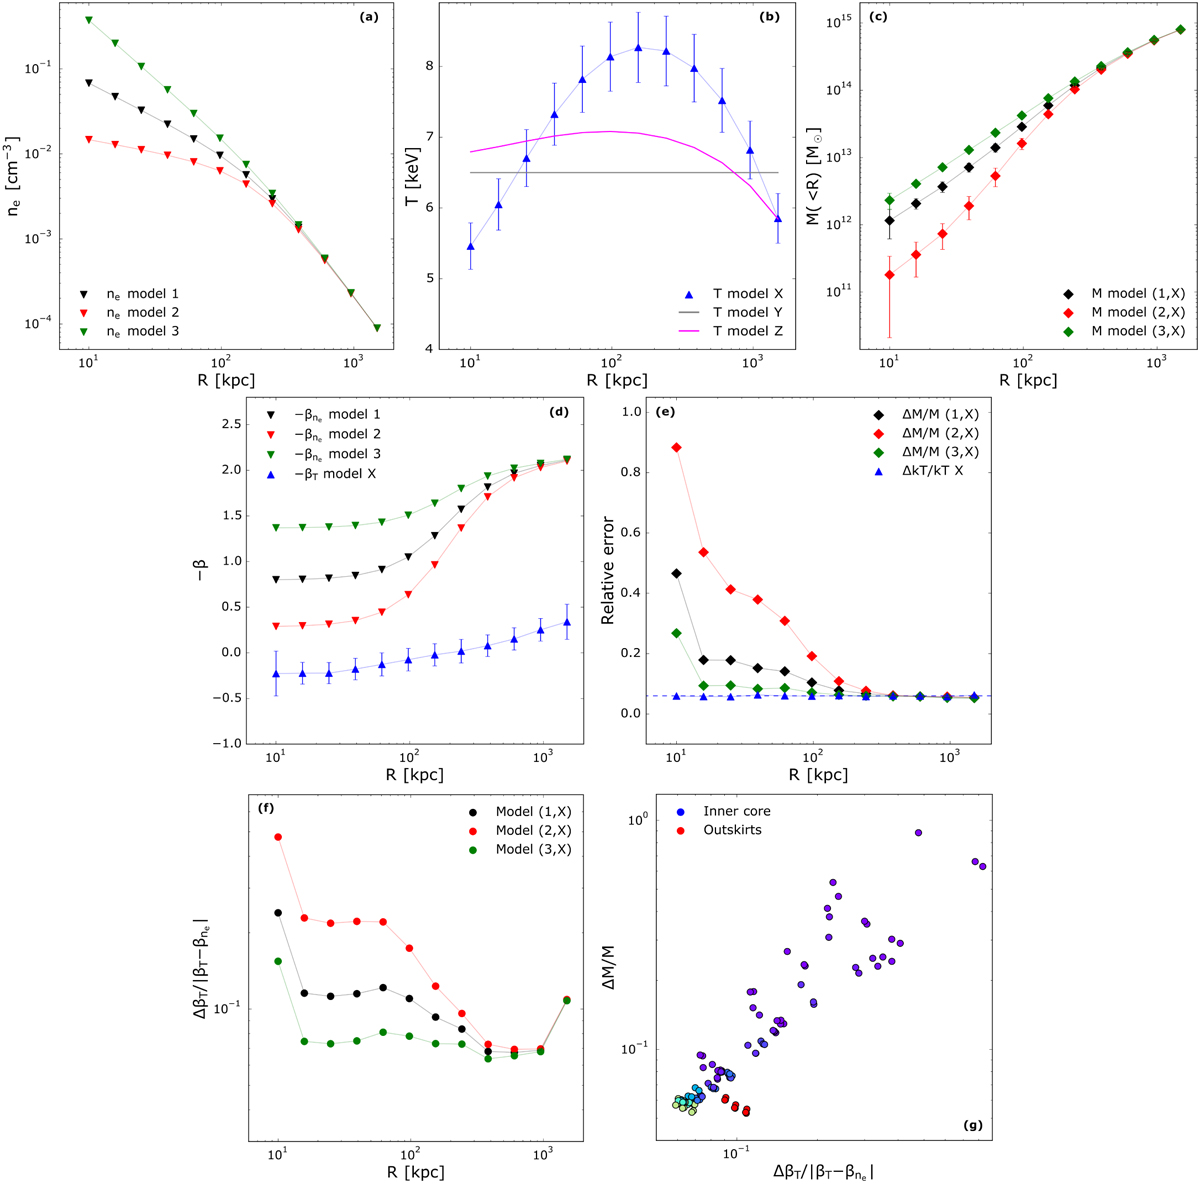
Panel a: density profiles generated using the parametric model of Vikhlinin et al. (2006). The errors are set to 0. Panel b: temperature profiles generated using the parametric model of Vikhlinin et al. (2006). The relative error on each bin is fixed to 6%. For clarity, bins and corresponding errors are reported only for “T model X”. We report only the shape form of “T model Y” and “T model Z” with solid grey and magenta lines, respectively. Panel c: hydrostatic mass profiles derived from the three density profiles and from the temperature profile “T model X” shown in panel a and b, respectively, using the FP method. Panel d: β is defined as the logarithmic derivative of the density and temperature, namely β(ne) and β(kT), with respect to the logarithm of the radius, β≡∂ ln x/β ln r. The errors of β(kT) are derived via a Monte-Carlo procedure. Panel e: temperature and mass profile relative errors as a function of the radius. The dotted line represents the 6% relative error. The mass profiles are computed using the three density profiles and the “T model X”. Panel f: ratio between the error of β(kT) and the distance D between β(ne) and β(kT), the distance being defined as D ≡ |β(kT) – β(ne). Panel g: mass profile relative errors as a function of the same quantity shown on the y axis of panel f. For this plot, we also included the results using all the temperature profiles. Points are colour-coded in order to clearly identify the inner core (blue points, upper right part of the plot) and the outskirts (red points, lower left part of the plot). For all the panels except panel g: points represent the quantity measured at fixed radial bins. The solid line is showed to guide the eye.
Current usage metrics show cumulative count of Article Views (full-text article views including HTML views, PDF and ePub downloads, according to the available data) and Abstracts Views on Vision4Press platform.
Data correspond to usage on the plateform after 2015. The current usage metrics is available 48-96 hours after online publication and is updated daily on week days.
Initial download of the metrics may take a while.