Fig. 10
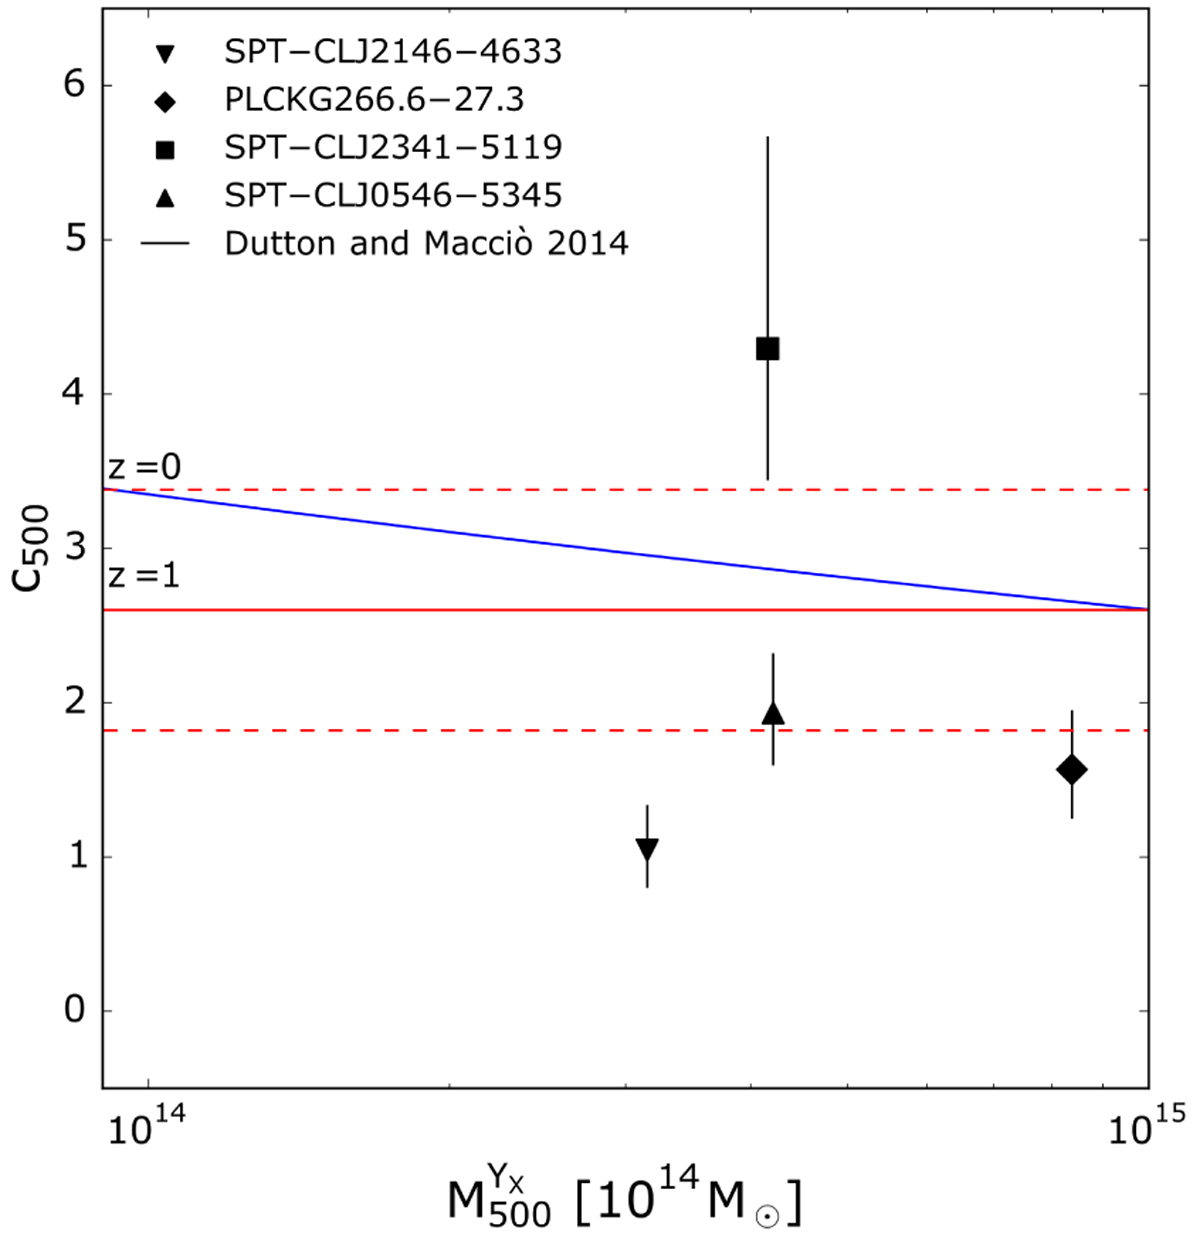
Concentration-mass relation. The c500 is derived from the DF NFW model. Blue and red solid lines represent the theoretical relations from the suite of cosmological simulations of Dutton & Macciò (2014). Dotted lines represent the 30% scatter (Bhattacharya et al. 2013) for the z = 1 relation. The concentration of SPT–CL J2106–5844 is not reported because the data radial coverage does not allow a robust determination of c500.
Current usage metrics show cumulative count of Article Views (full-text article views including HTML views, PDF and ePub downloads, according to the available data) and Abstracts Views on Vision4Press platform.
Data correspond to usage on the plateform after 2015. The current usage metrics is available 48-96 hours after online publication and is updated daily on week days.
Initial download of the metrics may take a while.