Fig. 1
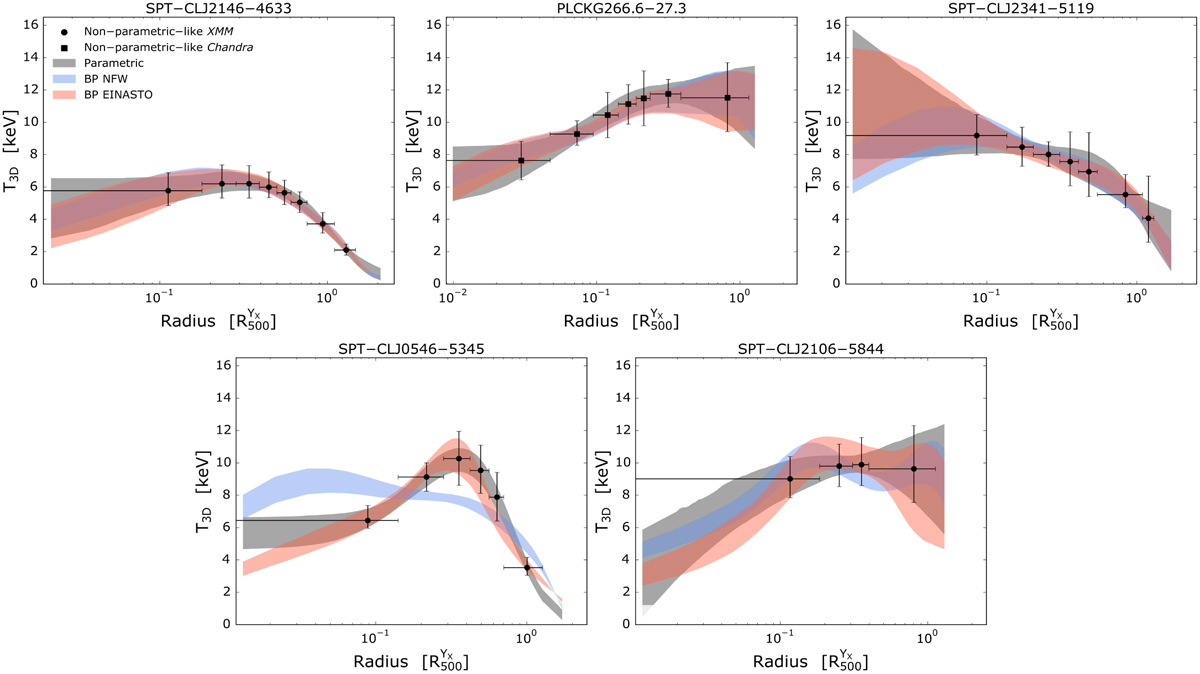
3D temperature profiles of all the clusters of our sample. Radii are scaled by ![]() . Section 2.3.2 describes the temperature profile calculation. For each panel: the black points represent the non-parametric-like 3D temperature profiles measured using Chandra and XMM-Newton, with round and squared points, respectively. The grey shaded area represents the best-fitting 3D parametric model (Vikhlinin et al. 2006). The blue and red areas represent the result of the backward fit (BP approach, see Sect. 2.4.1), assuming hydrostatic equilibrium and an NFW or an Einasto mass profile, respectively. The parametric models were estimated only in the radial range covered by the density profile. The shaded regions correspond to the 68% confidence level regions.
. Section 2.3.2 describes the temperature profile calculation. For each panel: the black points represent the non-parametric-like 3D temperature profiles measured using Chandra and XMM-Newton, with round and squared points, respectively. The grey shaded area represents the best-fitting 3D parametric model (Vikhlinin et al. 2006). The blue and red areas represent the result of the backward fit (BP approach, see Sect. 2.4.1), assuming hydrostatic equilibrium and an NFW or an Einasto mass profile, respectively. The parametric models were estimated only in the radial range covered by the density profile. The shaded regions correspond to the 68% confidence level regions.
Current usage metrics show cumulative count of Article Views (full-text article views including HTML views, PDF and ePub downloads, according to the available data) and Abstracts Views on Vision4Press platform.
Data correspond to usage on the plateform after 2015. The current usage metrics is available 48-96 hours after online publication and is updated daily on week days.
Initial download of the metrics may take a while.