Fig. 8
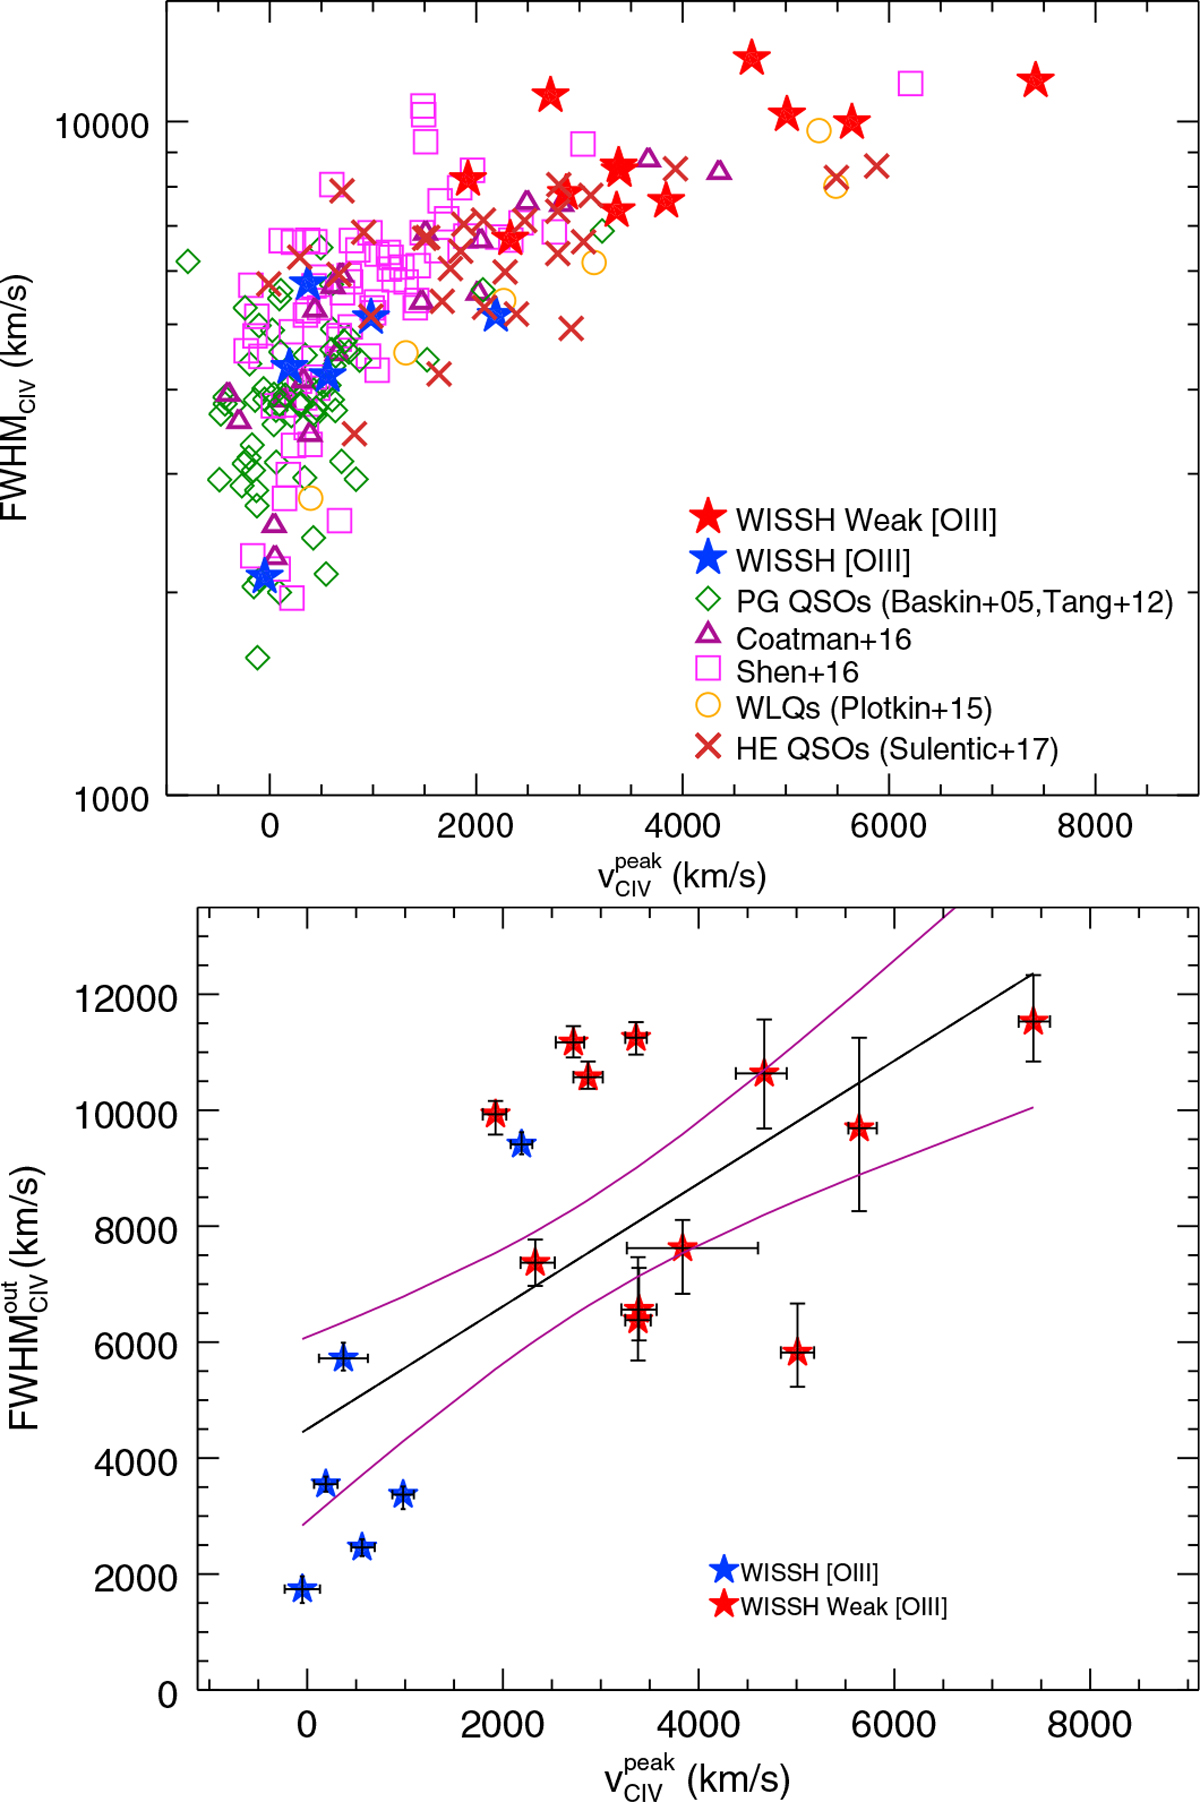
FWHMCIV of the entire emission line profile as a function of ![]() for the WISSH sample, compared to PG QSOs from Baskin & Laor (2005) and Tang et al. (2012; green diamonds), WLQs from Plotkin et al. (2015; orange circles), SDSS QSOs from Shen (2016) and Coatman et al. (2016: magenta squares and purple triangles respectively), and HE QSOs from Sulentic et al. (2017; top) and FWHM(CIV) of the outflow component (bottom) as a function of
for the WISSH sample, compared to PG QSOs from Baskin & Laor (2005) and Tang et al. (2012; green diamonds), WLQs from Plotkin et al. (2015; orange circles), SDSS QSOs from Shen (2016) and Coatman et al. (2016: magenta squares and purple triangles respectively), and HE QSOs from Sulentic et al. (2017; top) and FWHM(CIV) of the outflow component (bottom) as a function of![]() for the WISSH sample. The black solid line indicates the best linear fits to the data and the purple dashed lines correspond to the 68% confidence interval.
for the WISSH sample. The black solid line indicates the best linear fits to the data and the purple dashed lines correspond to the 68% confidence interval.
Current usage metrics show cumulative count of Article Views (full-text article views including HTML views, PDF and ePub downloads, according to the available data) and Abstracts Views on Vision4Press platform.
Data correspond to usage on the plateform after 2015. The current usage metrics is available 48-96 hours after online publication and is updated daily on week days.
Initial download of the metrics may take a while.