Fig. 6
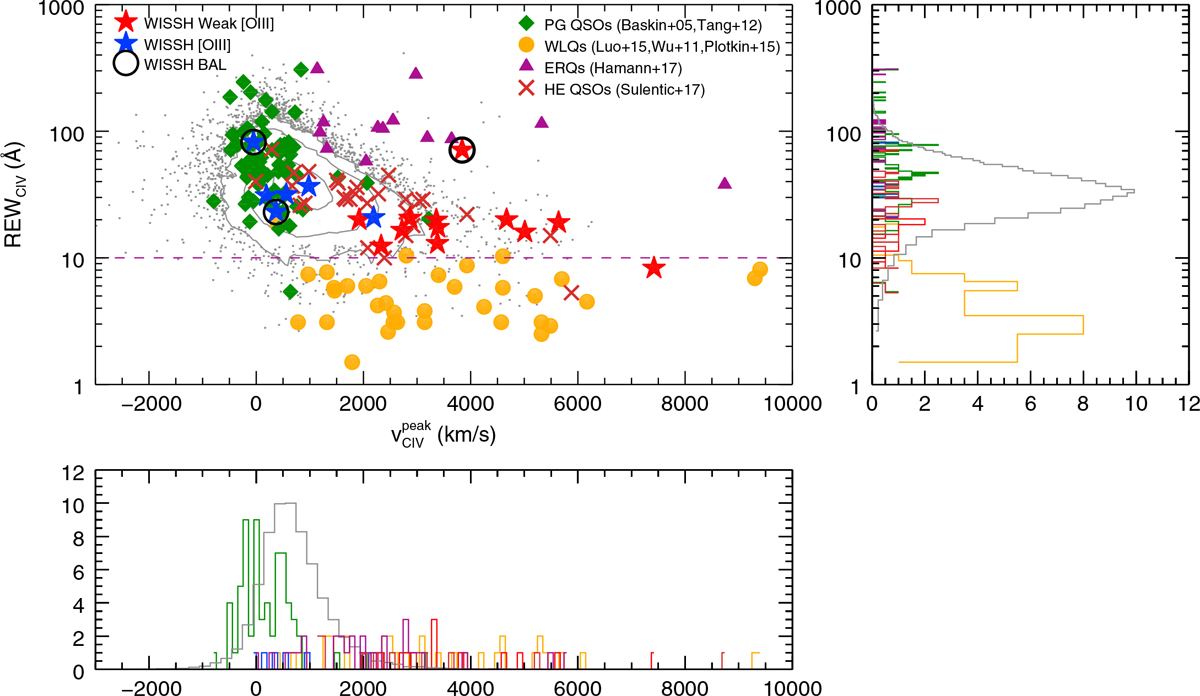
REWCIV as a functionof ![]() for different samples. The WISSH QSOs are indicated by blue and red stars, for the [OIII] and Weak [OIII] sample respectively.The BAL WISSH QSOs are indicated with black circles. Contours levels (0.03, 0.1, 0.5, and 0.9 relative to the peak) refer to the SDSS DR7 sample from Shen et al. (2011). The green diamonds indicate the PG QSOs from Baskin & Laor (2005) and Tang et al. (2012). The orange circles refer to the sample of WLQs from Plotkin et al. (2015), Luo et al. (2015), and Wu et al. (2011), the brown crosses indicate the HE QSOs from Sulentic et al. (2017), the ERQs from Hamann et al. (2017) are indicated with purple triangles. The purple dashed line marks the REWCIV = 10 Å, which is the threshold for the WLQs. The distribution of the REWCIV and
for different samples. The WISSH QSOs are indicated by blue and red stars, for the [OIII] and Weak [OIII] sample respectively.The BAL WISSH QSOs are indicated with black circles. Contours levels (0.03, 0.1, 0.5, and 0.9 relative to the peak) refer to the SDSS DR7 sample from Shen et al. (2011). The green diamonds indicate the PG QSOs from Baskin & Laor (2005) and Tang et al. (2012). The orange circles refer to the sample of WLQs from Plotkin et al. (2015), Luo et al. (2015), and Wu et al. (2011), the brown crosses indicate the HE QSOs from Sulentic et al. (2017), the ERQs from Hamann et al. (2017) are indicated with purple triangles. The purple dashed line marks the REWCIV = 10 Å, which is the threshold for the WLQs. The distribution of the REWCIV and ![]() are on the right and on the bottom, respectively.
are on the right and on the bottom, respectively.
Current usage metrics show cumulative count of Article Views (full-text article views including HTML views, PDF and ePub downloads, according to the available data) and Abstracts Views on Vision4Press platform.
Data correspond to usage on the plateform after 2015. The current usage metrics is available 48-96 hours after online publication and is updated daily on week days.
Initial download of the metrics may take a while.