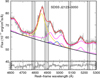
Fig. B.1
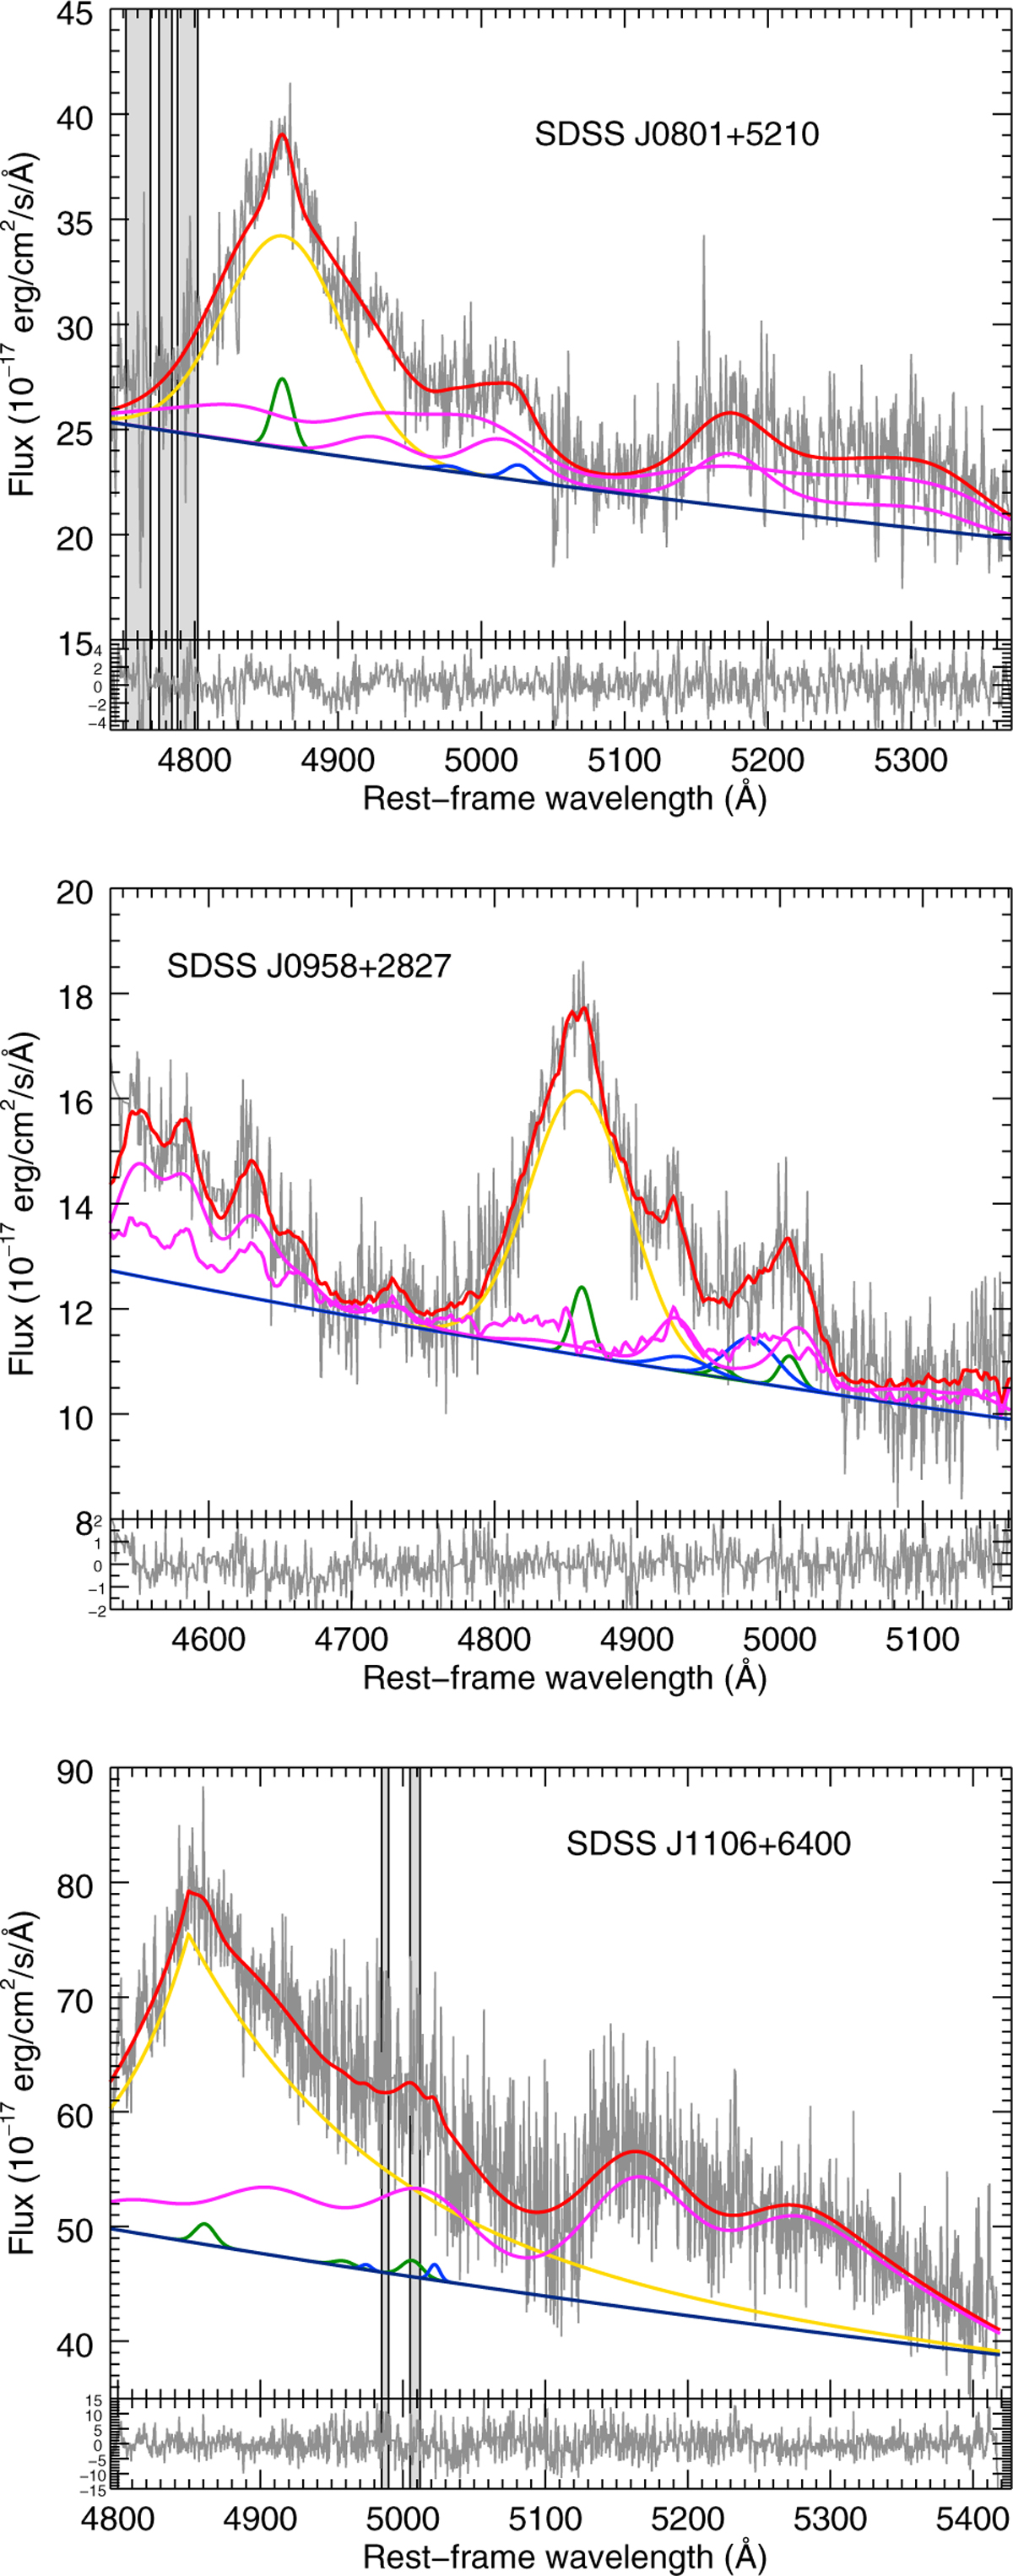
Thered line shows the best fit of the spectrum. Green curve refers to the core component associated with the NLR emission of Hβ and [OIII] emission lines. Blue curve refers to the broad blueshifted emission of [OIII]λλ4959,5007 Å, indicative of outflow. Gold curve indicates the broad component of Hβ associated with BLR emission. FeII emission is indicated in magenta. Grey band indicates the region excluded from the fit because of the presence of sky line residual. Lower panel shows the fit residuals.
Current usage metrics show cumulative count of Article Views (full-text article views including HTML views, PDF and ePub downloads, according to the available data) and Abstracts Views on Vision4Press platform.
Data correspond to usage on the plateform after 2015. The current usage metrics is available 48-96 hours after online publication and is updated daily on week days.
Initial download of the metrics may take a while.