Fig. 13
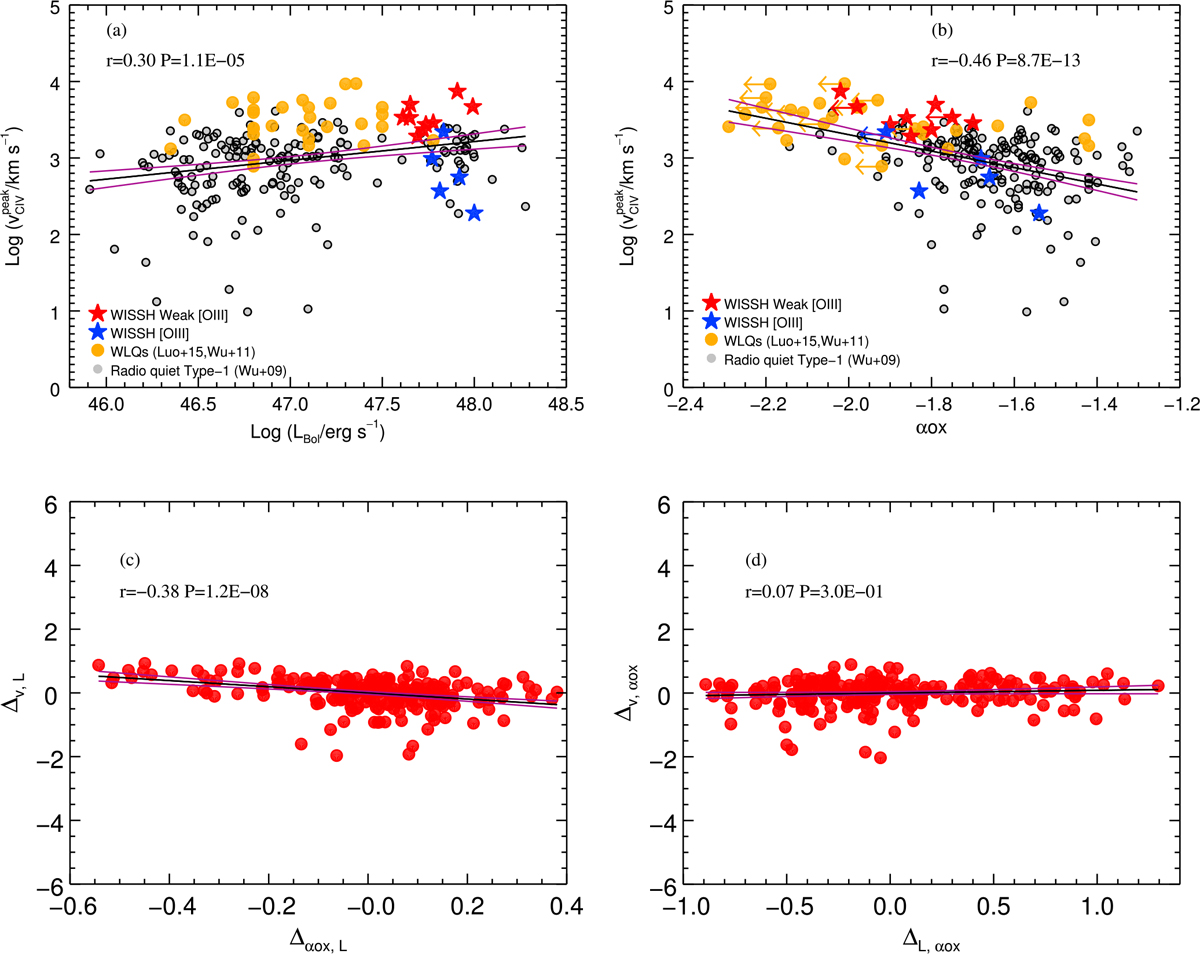
The velocity shift ![]() as a function of LBol (a) and αOX (b), for the WISSH sample (blue and red stars) compared to radio quiet type-1 QSOs from Wu et al. (2009; black circles) and WLQs from Wu et al. (2011) and Luo et al. (2015; orange circles). c) Residuals plot of
as a function of LBol (a) and αOX (b), for the WISSH sample (blue and red stars) compared to radio quiet type-1 QSOs from Wu et al. (2009; black circles) and WLQs from Wu et al. (2011) and Luo et al. (2015; orange circles). c) Residuals plot of ![]() –LBol and αOX –LBol relations. d) Residuals plot of
–LBol and αOX –LBol relations. d) Residuals plot of ![]() –αOX and LBol –αOX relations. The black lines represent the best linear fits to the data and the purple lines correspond to the 68% confidence interval.
–αOX and LBol –αOX relations. The black lines represent the best linear fits to the data and the purple lines correspond to the 68% confidence interval.
Current usage metrics show cumulative count of Article Views (full-text article views including HTML views, PDF and ePub downloads, according to the available data) and Abstracts Views on Vision4Press platform.
Data correspond to usage on the plateform after 2015. The current usage metrics is available 48-96 hours after online publication and is updated daily on week days.
Initial download of the metrics may take a while.