Fig. 12
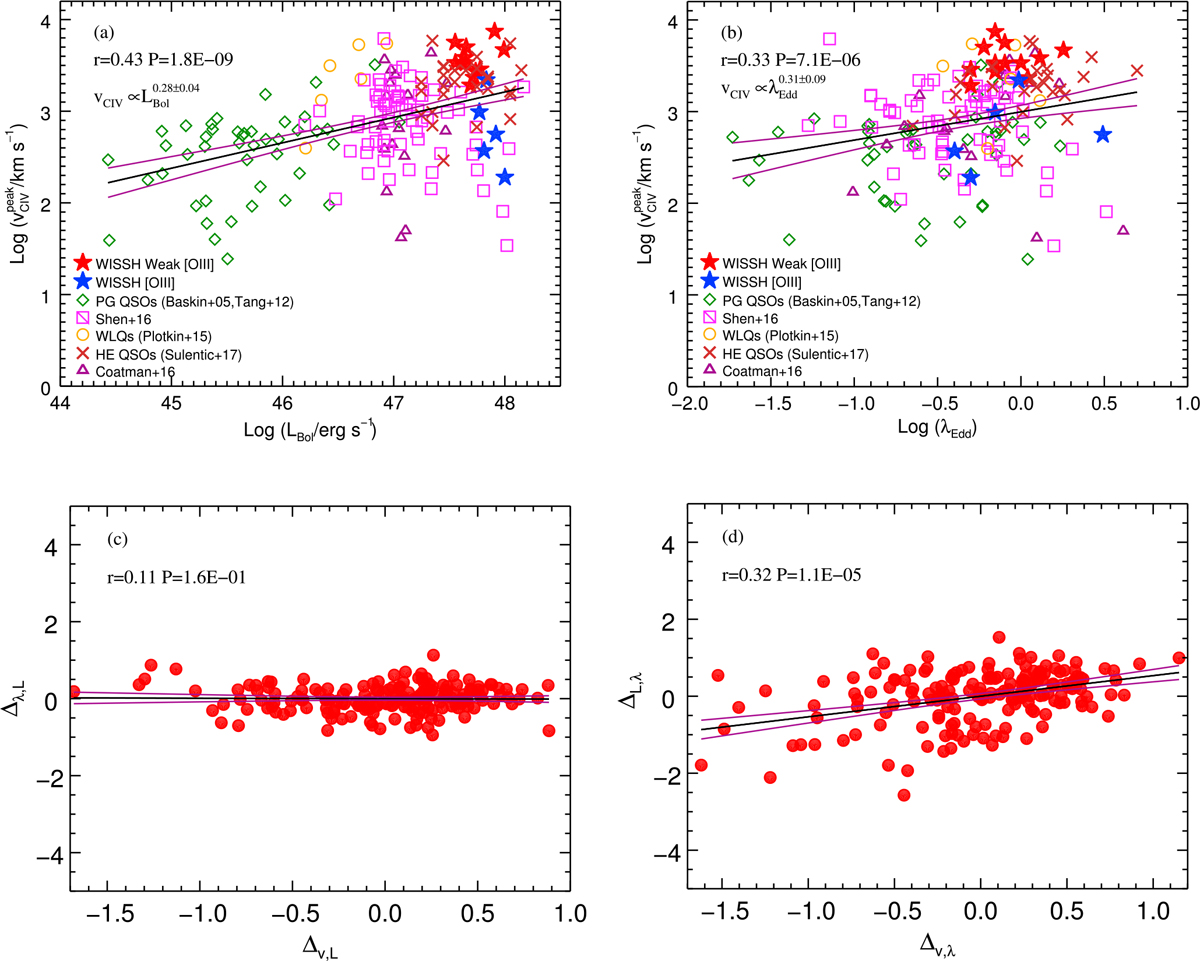
The velocity shift ![]() as a function of LBol (a) and as a function of λEdd (b), for the WISSH sample (blue and red stars) compared to the PG QSOs from Baskin & Laor (2005) and Tang et al. (2012; greendiamonds), WLQs from Plotkin et al. (2015; orange circles), SDSS QSOs from Shen (2016) and Coatman et al. (2016;magenta squares and purple triangles), and HE QSOs from Sulentic et al. (2017, and reference therein). The LBol for the HE sample has been derived from L5100 applying a bolometric correction of 5.6, as suggested by Runnoe et al. (2012) for the luminosity range of the HE sample. c) Residuals plot of λEdd–LBol and
as a function of LBol (a) and as a function of λEdd (b), for the WISSH sample (blue and red stars) compared to the PG QSOs from Baskin & Laor (2005) and Tang et al. (2012; greendiamonds), WLQs from Plotkin et al. (2015; orange circles), SDSS QSOs from Shen (2016) and Coatman et al. (2016;magenta squares and purple triangles), and HE QSOs from Sulentic et al. (2017, and reference therein). The LBol for the HE sample has been derived from L5100 applying a bolometric correction of 5.6, as suggested by Runnoe et al. (2012) for the luminosity range of the HE sample. c) Residuals plot of λEdd–LBol and ![]() –LBol relations. d) Residuals plot of LBol–λEdd and
–LBol relations. d) Residuals plot of LBol–λEdd and ![]() –λEdd relations. The black lines indicate the best linear fits to the data and the purple lines correspond to the 68% confidence interval.
–λEdd relations. The black lines indicate the best linear fits to the data and the purple lines correspond to the 68% confidence interval.
Current usage metrics show cumulative count of Article Views (full-text article views including HTML views, PDF and ePub downloads, according to the available data) and Abstracts Views on Vision4Press platform.
Data correspond to usage on the plateform after 2015. The current usage metrics is available 48-96 hours after online publication and is updated daily on week days.
Initial download of the metrics may take a while.