Fig. A.1.
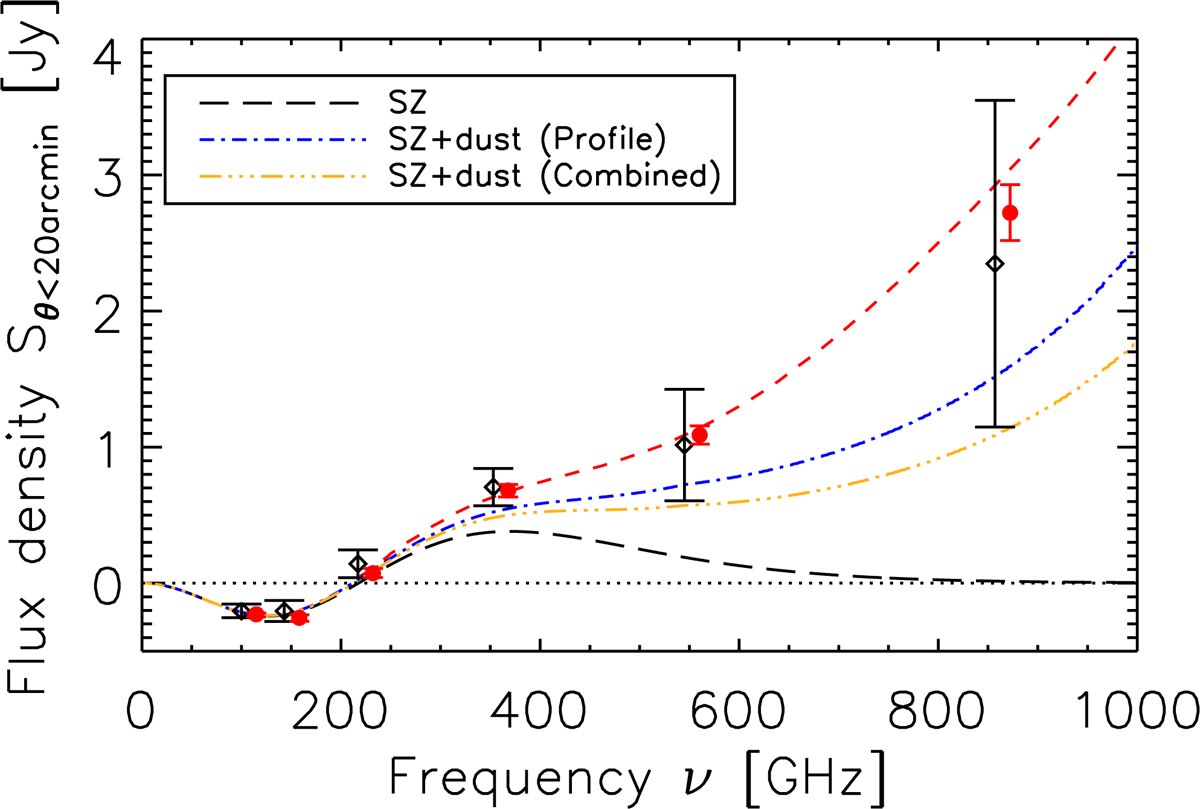
Fixed aperture photometry. This figure is to be compared to Fig. 7 of Planck Collaboration XXIII (2016). The y-axis shows the average flux density of a cluster, so it needs to be multiplied by 1091 (the number of clusters in the analysis) to give the total flux density of the stack. Our data points are shown as black diamonds, and the points from Planck Collaboration XXIII (2016) as red filled circles (shifted by +10 GHz for clarity). Our models are shown in blue and orange, and the model from Planck Collaboration XXIII (2016) is shown in red. The black dashed line gives the contribution from the SZ signal alone.
Current usage metrics show cumulative count of Article Views (full-text article views including HTML views, PDF and ePub downloads, according to the available data) and Abstracts Views on Vision4Press platform.
Data correspond to usage on the plateform after 2015. The current usage metrics is available 48-96 hours after online publication and is updated daily on week days.
Initial download of the metrics may take a while.