Fig. 5.
Cluster size ![]() extracted blindly versus
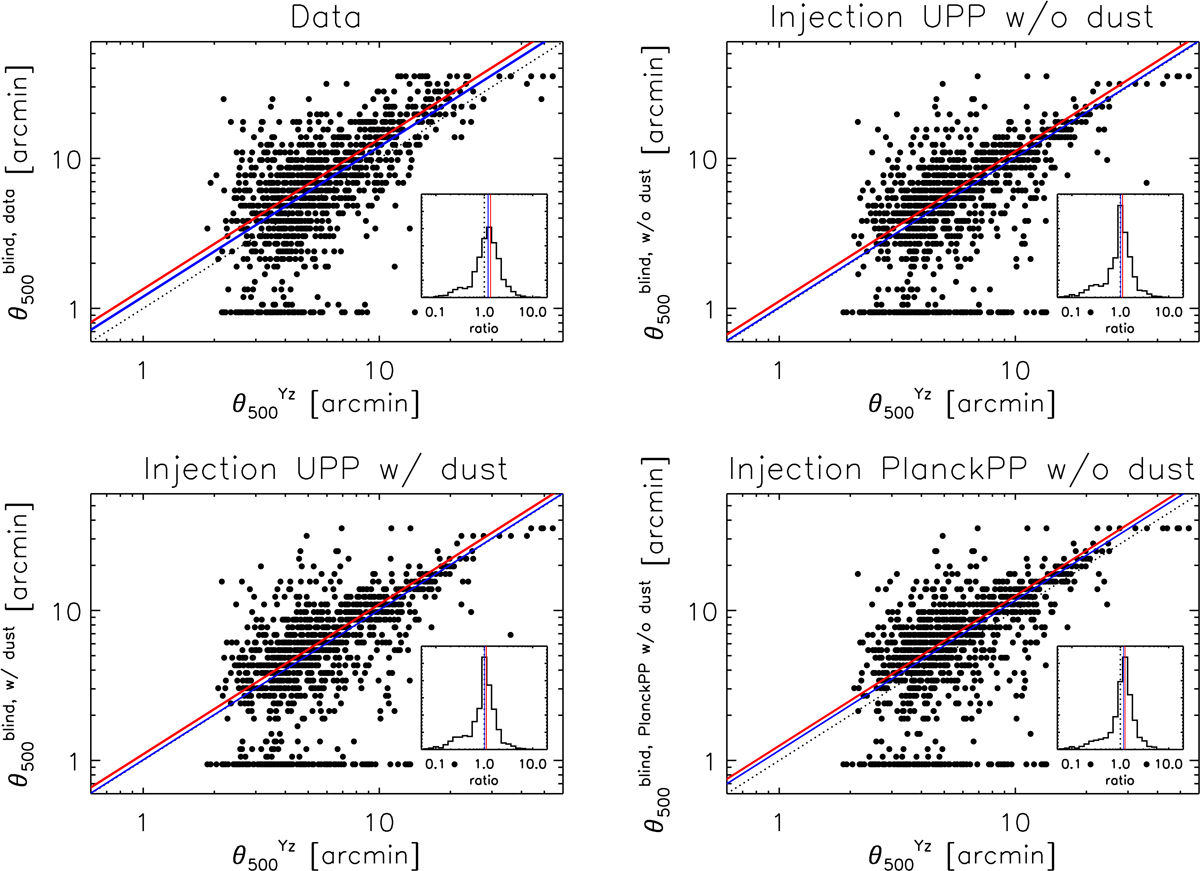
extracted blindly versus ![]() from the Planck mass proxy. The universal pressure profile is used in the matched filter for the extraction in the four panels. Top left panel: extraction from Planck data. The blind sizes are systematically overestimated with respect to the size derived from the mass proxy (equivalent to a XMM-Newton size). The mean (median) of the ratio
from the Planck mass proxy. The universal pressure profile is used in the matched filter for the extraction in the four panels. Top left panel: extraction from Planck data. The blind sizes are systematically overestimated with respect to the size derived from the mass proxy (equivalent to a XMM-Newton size). The mean (median) of the ratio ![]() is 1.35 (1.20) and is displayed as the red (blue) line. The thickness of the line encapsulates the 68% error on the mean (median) calculated with bootstrap. The histogram of this ratio is shown in the inset. Top right panel: extraction from injections in Planck data assuming that the SZ emission follows the universal pressure profile (UPP, Arnaud et al. 2010). No dust emission was included. The value for the mean (median) is 1.12 (1.02). There is no strong overestimation of the size as on the actual data. Bottom left panel: same as top right but adding the dust component based on the best combined fit (white cross in Fig. 3). The mean (median) is 1.10 (1.01). The impact of the dust component on the size estimation is negligible. Bottom right panel: same as top right but using the Planck pressure profile instead of the UPP to simulate clusters. The mean (median) is 1.25 (1.16). The blind sizes are overestimated as for the Planck data, although the histogram in the inset is less dispersed. The dotted line in all four panels is the equality line.
is 1.35 (1.20) and is displayed as the red (blue) line. The thickness of the line encapsulates the 68% error on the mean (median) calculated with bootstrap. The histogram of this ratio is shown in the inset. Top right panel: extraction from injections in Planck data assuming that the SZ emission follows the universal pressure profile (UPP, Arnaud et al. 2010). No dust emission was included. The value for the mean (median) is 1.12 (1.02). There is no strong overestimation of the size as on the actual data. Bottom left panel: same as top right but adding the dust component based on the best combined fit (white cross in Fig. 3). The mean (median) is 1.10 (1.01). The impact of the dust component on the size estimation is negligible. Bottom right panel: same as top right but using the Planck pressure profile instead of the UPP to simulate clusters. The mean (median) is 1.25 (1.16). The blind sizes are overestimated as for the Planck data, although the histogram in the inset is less dispersed. The dotted line in all four panels is the equality line.
Current usage metrics show cumulative count of Article Views (full-text article views including HTML views, PDF and ePub downloads, according to the available data) and Abstracts Views on Vision4Press platform.
Data correspond to usage on the plateform after 2015. The current usage metrics is available 48-96 hours after online publication and is updated daily on week days.
Initial download of the metrics may take a while.