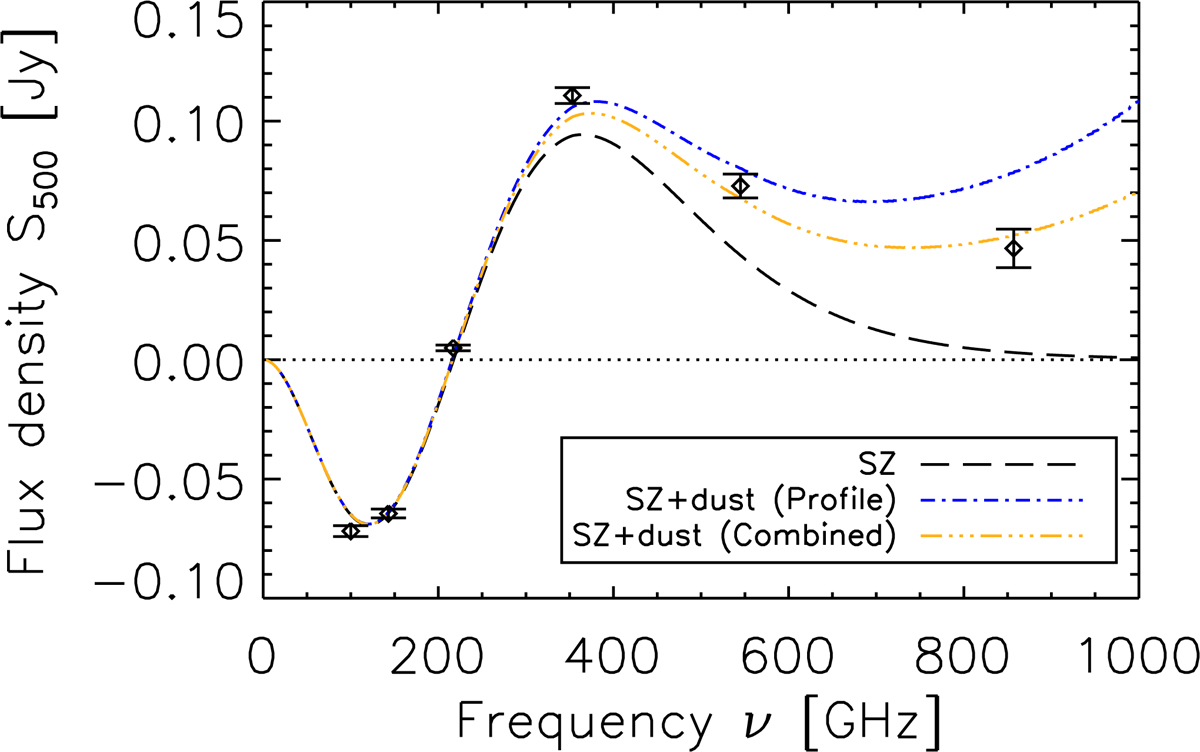
Fig. 4.

Inverse-variance weighted matched filter flux in the HFI maps (black diamonds) and associated bootstrap errors. The profile used in the matched filter is the universal pressure profile from Arnaud et al. (2010). The black dashed line shows the SZ contribution calculated by inverse-variance averaging the Planck Compton Y values. Blue dash-dotted and orange dash double-dotted lines show the SZ+dust models (blue: dust best fit from stacked PSZ2 profiles in the Planck 857 GHz band, orange: dust combined best fit from stacked PSZ2 profile and inverse-variance weighted matched filter flux in the Planck 857 GHz band).
Current usage metrics show cumulative count of Article Views (full-text article views including HTML views, PDF and ePub downloads, according to the available data) and Abstracts Views on Vision4Press platform.
Data correspond to usage on the plateform after 2015. The current usage metrics is available 48-96 hours after online publication and is updated daily on week days.
Initial download of the metrics may take a while.


