Fig. 3.
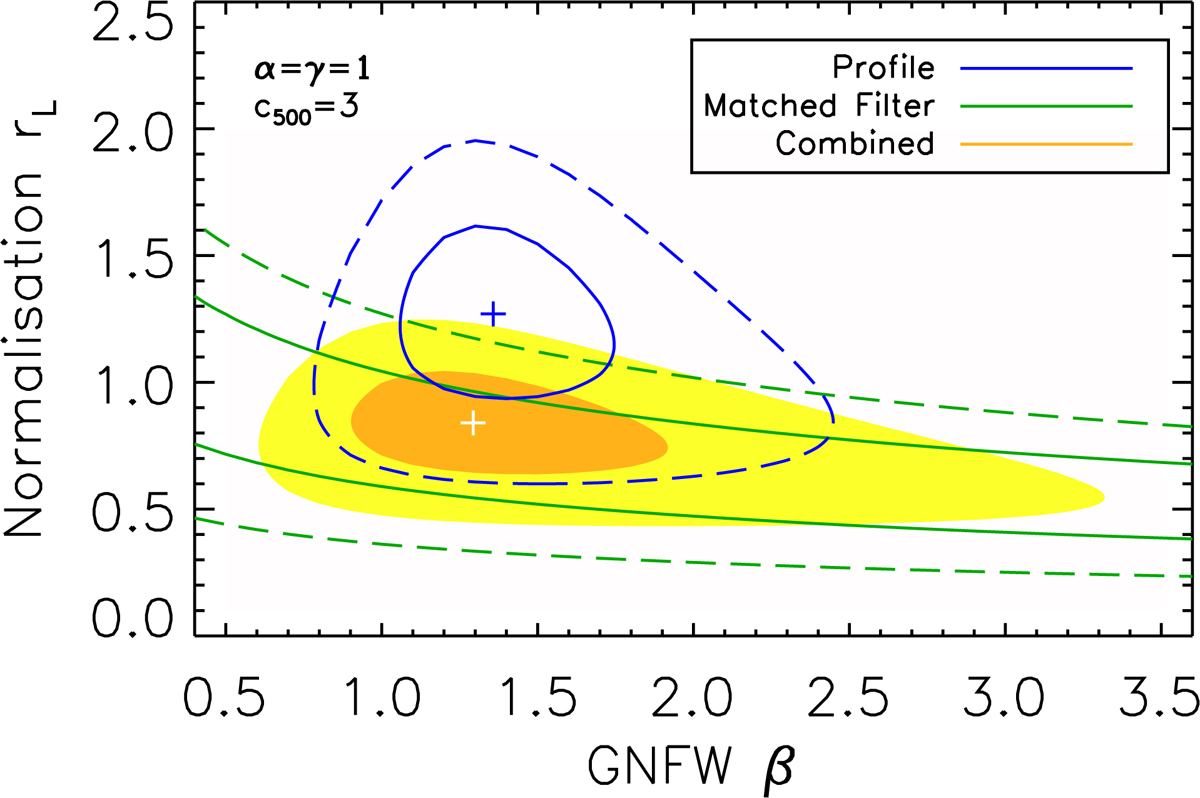
Contours at 68% and 95% c.l. on the normalization, rL, of the infrared L500,tot−M500 relation and on the external slope, β, of the spatial profile of the dust emission. Constraints are obtained from the stacked profile (blue) and from the inverse-variance weighted average matched filter flux (green), both in the Planck 857 GHz band. The combined constraint is shown as filled orange and yellow contours. The blue and white crosses shows the best value for the profile and combined fits, respectively.
Current usage metrics show cumulative count of Article Views (full-text article views including HTML views, PDF and ePub downloads, according to the available data) and Abstracts Views on Vision4Press platform.
Data correspond to usage on the plateform after 2015. The current usage metrics is available 48-96 hours after online publication and is updated daily on week days.
Initial download of the metrics may take a while.