Fig. 2.
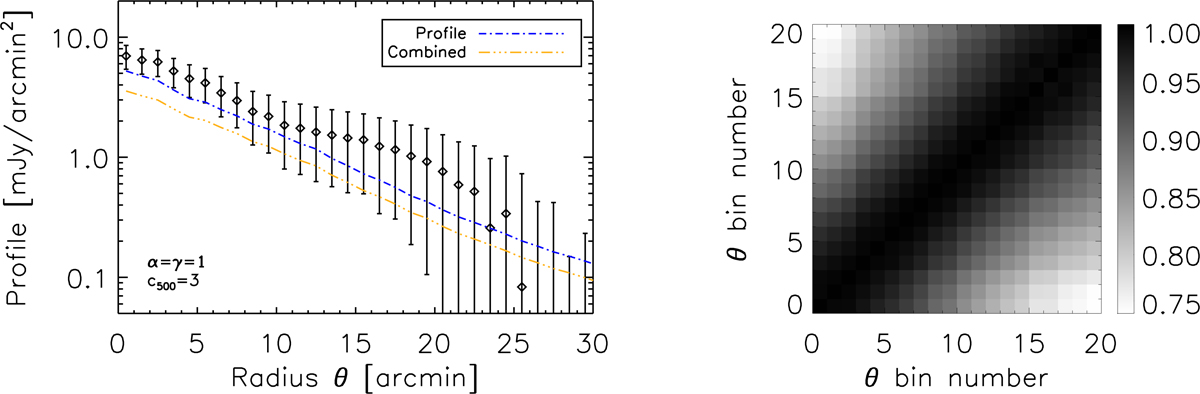
Left panel: stacked PSZ2 profiles in the 857 GHz Planck band (black diamonds) and best fit profile (blue dash-dotted line). Error bars are determined from bootstrap realizations. The data points are strongly correlated, as shown in the right panel. The orange dash-double dotted line shows the best fit profile obtained when adjusting jointly the stacked PSZ2 profile and the inverse-variance weighted average matched filter flux in the Planck 857 GHz band. Right panel: correlation matrix (diagonal normalized to unity) of the 20 first bins of the stacked profiles starting from the center (bin zero is the most central bin). The bins are strongly correlated (>75%).
Current usage metrics show cumulative count of Article Views (full-text article views including HTML views, PDF and ePub downloads, according to the available data) and Abstracts Views on Vision4Press platform.
Data correspond to usage on the plateform after 2015. The current usage metrics is available 48-96 hours after online publication and is updated daily on week days.
Initial download of the metrics may take a while.