Fig. B.1.
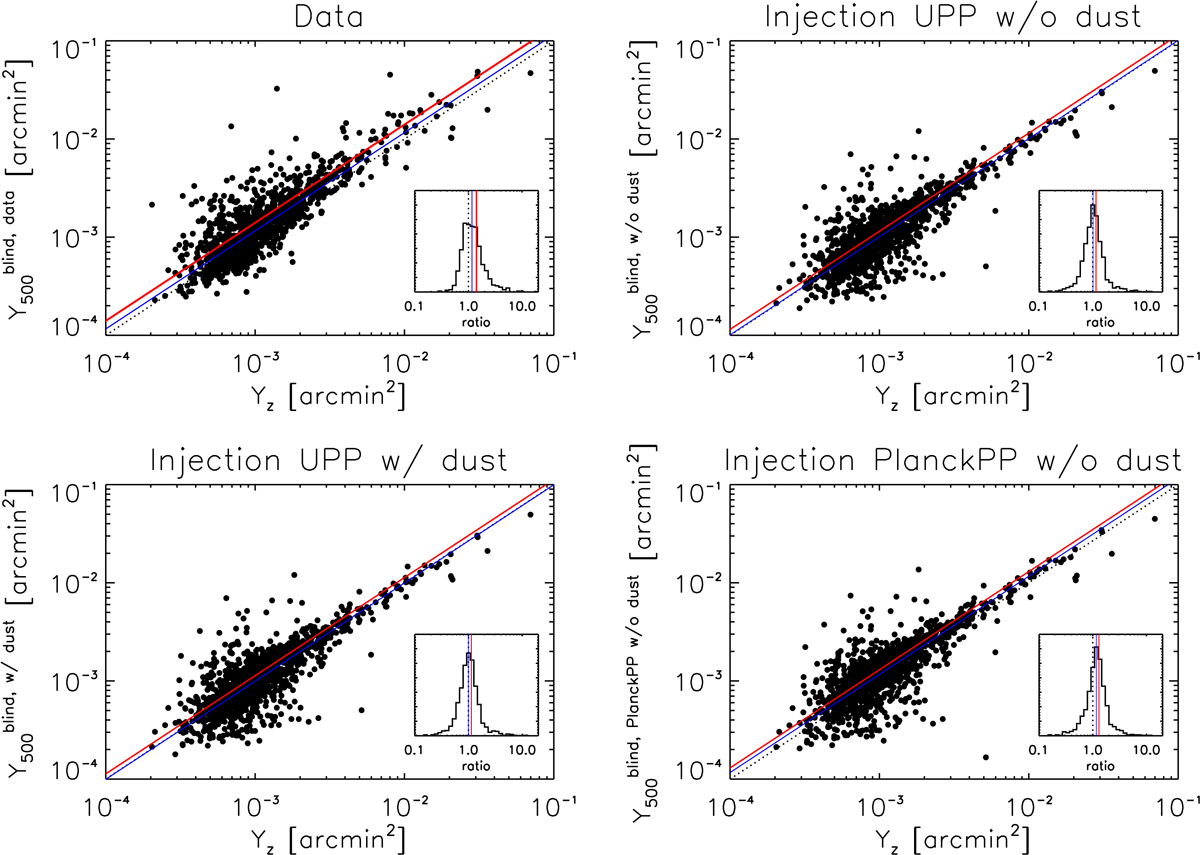
Same as Fig. 5, but for the flux ![]() (extracted blindly) and Yz (from the Planck mass proxy). Top left: for the data, the mean (median) of the ratio
(extracted blindly) and Yz (from the Planck mass proxy). Top left: for the data, the mean (median) of the ratio ![]() is 1.40 (1.16) and is displayed as the red (blue) line. The thickness of the line encapsulates the 68% error on the mean (median) calculated with a bootstrap. The histogram of this ratio is shown in the inset. Top right: for the injection of PSZ2 clusters using the UPP and without the dust component; the mean (median) is 1.15 (1.01). Bottom left: for the injection of PSZ2 clusters using the UPP and with the dust component; the mean (median) is 1.13 (1.00). Bottom right: for the injection of PSZ2 clusters using the PlanckPP and without the dust component; the mean (median) is 1.30 (1.17)– close to the values found with the data. The dotted line in all four panels is the equality line.
is 1.40 (1.16) and is displayed as the red (blue) line. The thickness of the line encapsulates the 68% error on the mean (median) calculated with a bootstrap. The histogram of this ratio is shown in the inset. Top right: for the injection of PSZ2 clusters using the UPP and without the dust component; the mean (median) is 1.15 (1.01). Bottom left: for the injection of PSZ2 clusters using the UPP and with the dust component; the mean (median) is 1.13 (1.00). Bottom right: for the injection of PSZ2 clusters using the PlanckPP and without the dust component; the mean (median) is 1.30 (1.17)– close to the values found with the data. The dotted line in all four panels is the equality line.
Current usage metrics show cumulative count of Article Views (full-text article views including HTML views, PDF and ePub downloads, according to the available data) and Abstracts Views on Vision4Press platform.
Data correspond to usage on the plateform after 2015. The current usage metrics is available 48-96 hours after online publication and is updated daily on week days.
Initial download of the metrics may take a while.