Fig. 9.
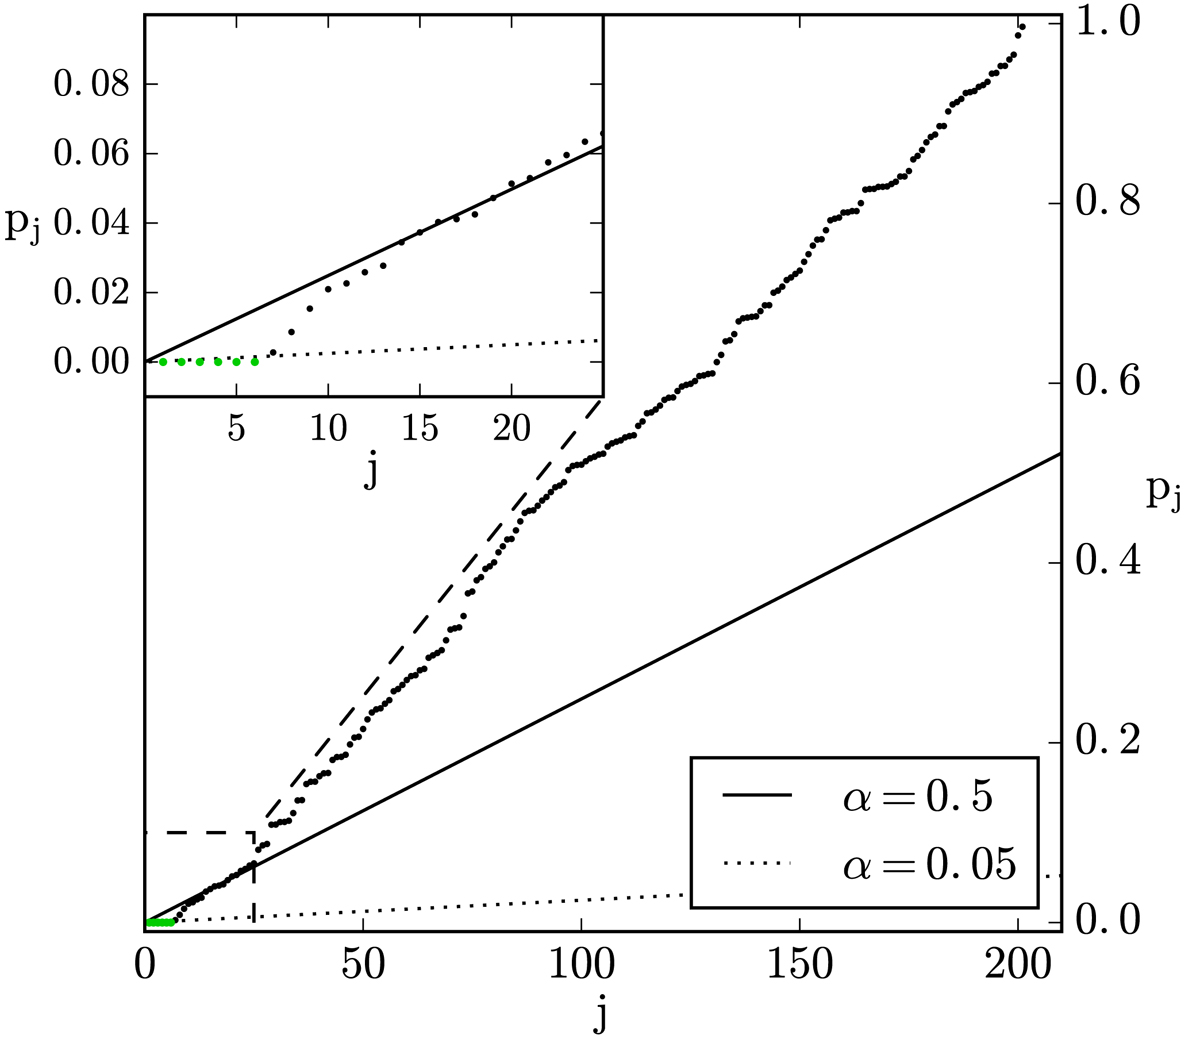
Application of the FDR method to the 201 identified continuum sources around M 51 with two values of the false discovery rate, α (5% and 50%). Each dot shows the p-value of a source, pj. The sources have been sorted by increasing p-value. The FDR method finds the (last) intersection of this distribution and a line with the slope ![]() , and classifies as reliable detections all the sources located to the left of the intersection (the green points have a 5% false discovery rate).
, and classifies as reliable detections all the sources located to the left of the intersection (the green points have a 5% false discovery rate).
Current usage metrics show cumulative count of Article Views (full-text article views including HTML views, PDF and ePub downloads, according to the available data) and Abstracts Views on Vision4Press platform.
Data correspond to usage on the plateform after 2015. The current usage metrics is available 48-96 hours after online publication and is updated daily on week days.
Initial download of the metrics may take a while.