Fig. 8.
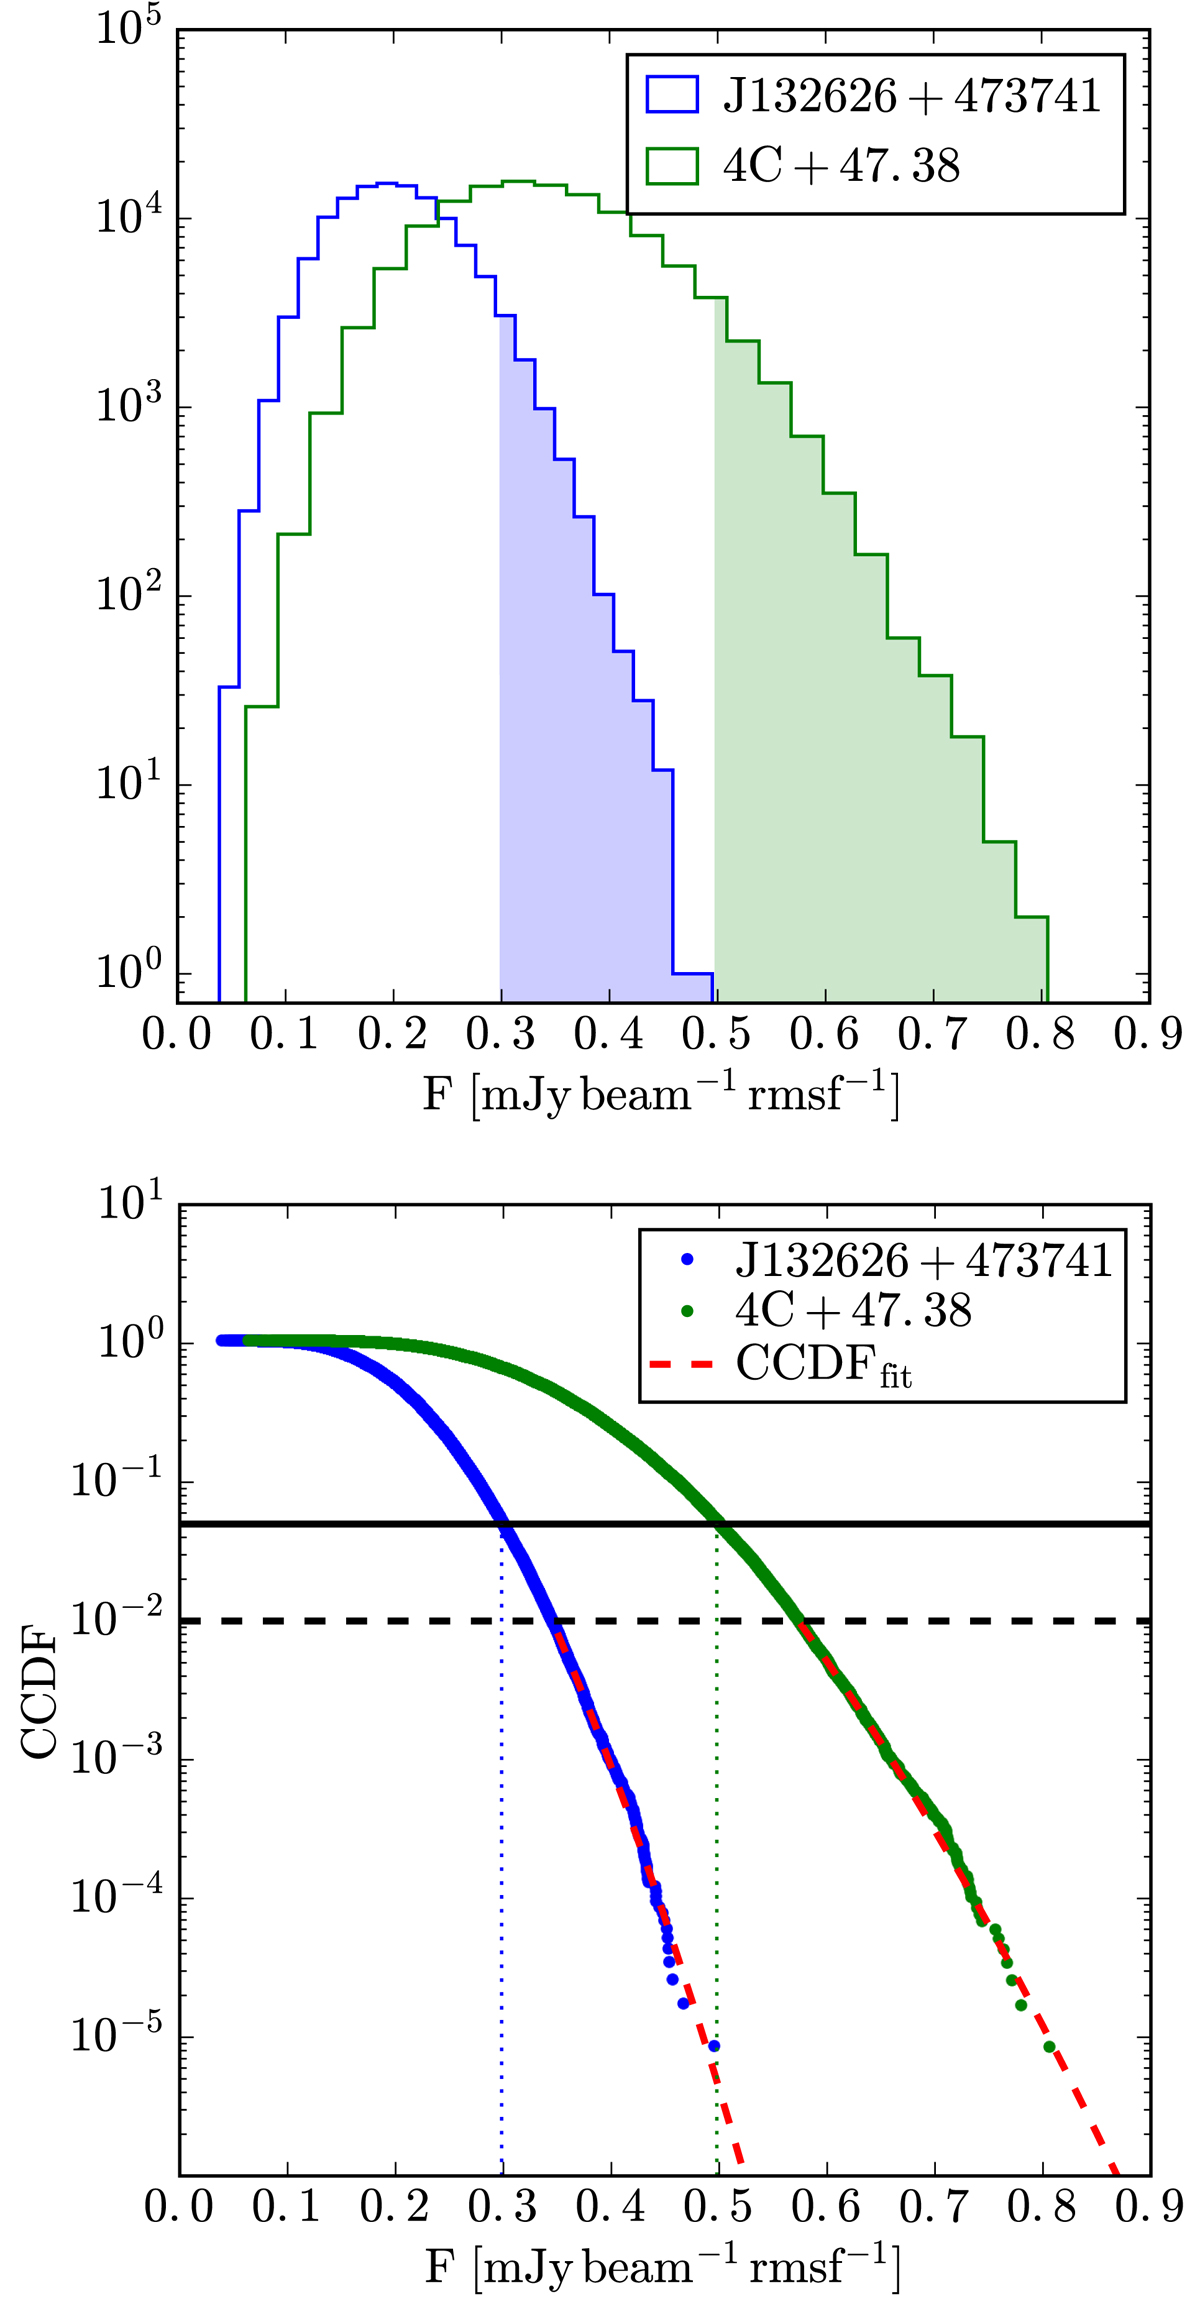
Characterization of the noise in the Faraday volumes of the two polarized sources, J132626+473741 (in blue, also presented in Fig. 7) and 4C+47.38 (in green). The measurements were extracted in the range of Faraday depths 100 rad m−2 ≤ |ϕ | ≤ 450 rad m−2 where no polarized signal is expected. Upper panel: histograms of local maxima. The histograms were not normalized since the two regions contain the same number of voxels. The shaded areas correspond to flux values in the top 5% of the distribution. The noise in the Faraday cube of 4C+47.38 is higher than for the other source (the histogram is broader) because the source lies at a greater distance from the center of the field. Lower panel: complementary cumulative distribution function (CCDF) for the same sources as in the first panel. The dots show the actual CCDF and the solid line is the Gaussian fit used to model the distribution at high F (calculated at CCDF(F) ≤ 10−2, as indicated by the dashed line). The horizontal solid line at CCDF = 0.05 corresponds to the lower limit of the shaded distributions in the upper panel.
Current usage metrics show cumulative count of Article Views (full-text article views including HTML views, PDF and ePub downloads, according to the available data) and Abstracts Views on Vision4Press platform.
Data correspond to usage on the plateform after 2015. The current usage metrics is available 48-96 hours after online publication and is updated daily on week days.
Initial download of the metrics may take a while.