Fig. 7.
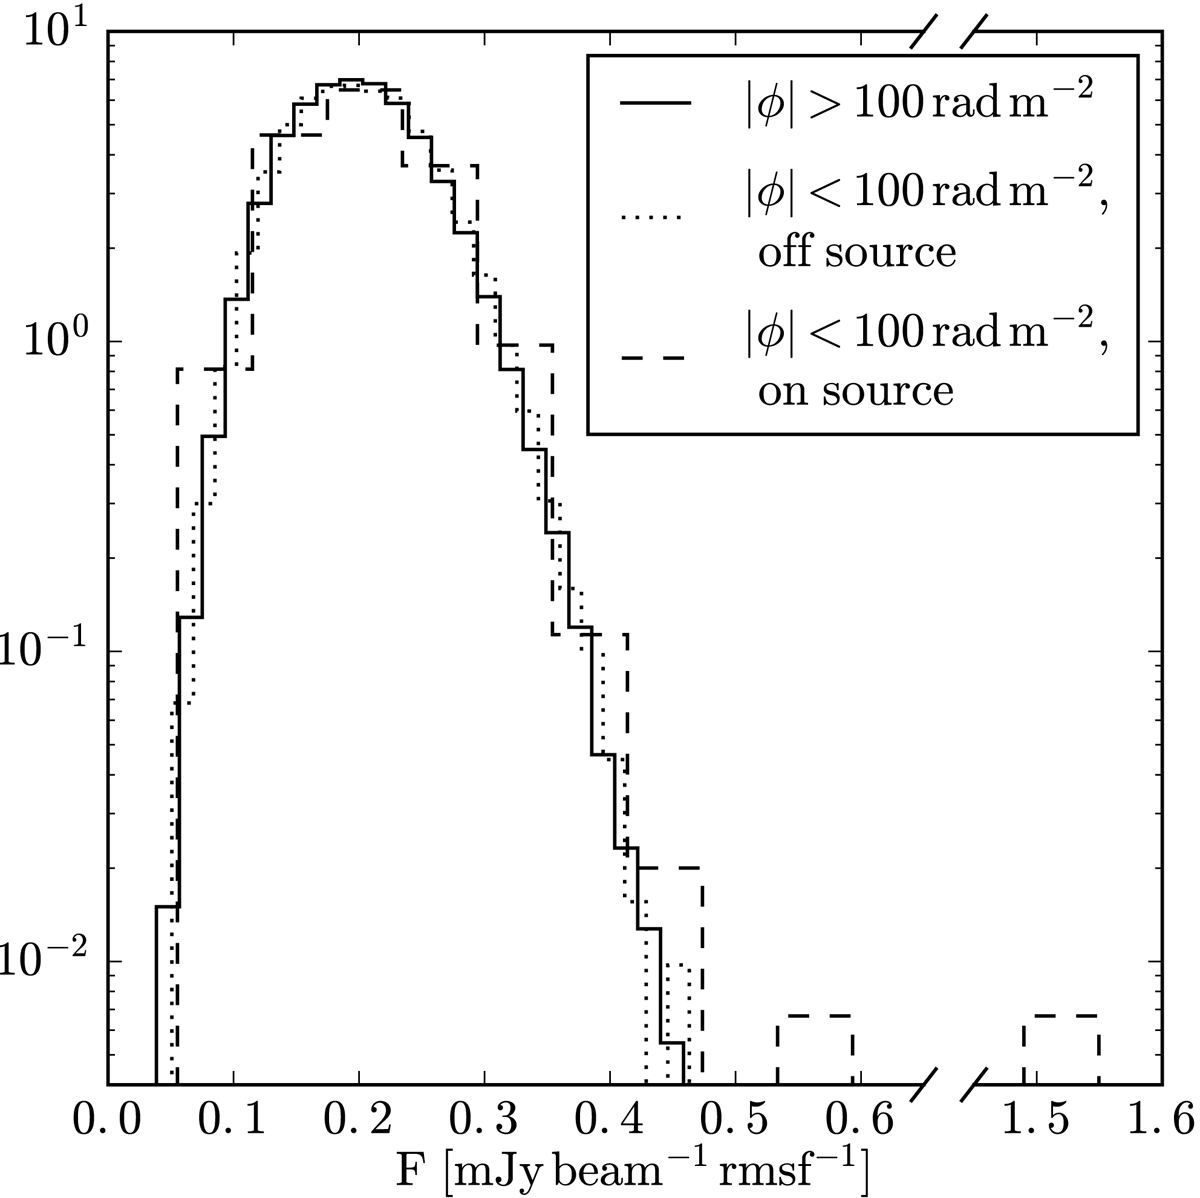
Histograms of local maxima in different regions of the Faraday cube around the polarized source J132626+473741. The histograms have been normalized to facilitate comparisons. The instrumental polarization range, as defined in Sect. 4.5.1, has been excluded from the data. The distribution of local maxima on-source and at Faraday depths |ϕ| < 100 rad m−2 shows a clear excess at larger F.
Current usage metrics show cumulative count of Article Views (full-text article views including HTML views, PDF and ePub downloads, according to the available data) and Abstracts Views on Vision4Press platform.
Data correspond to usage on the plateform after 2015. The current usage metrics is available 48-96 hours after online publication and is updated daily on week days.
Initial download of the metrics may take a while.