Fig. 6.
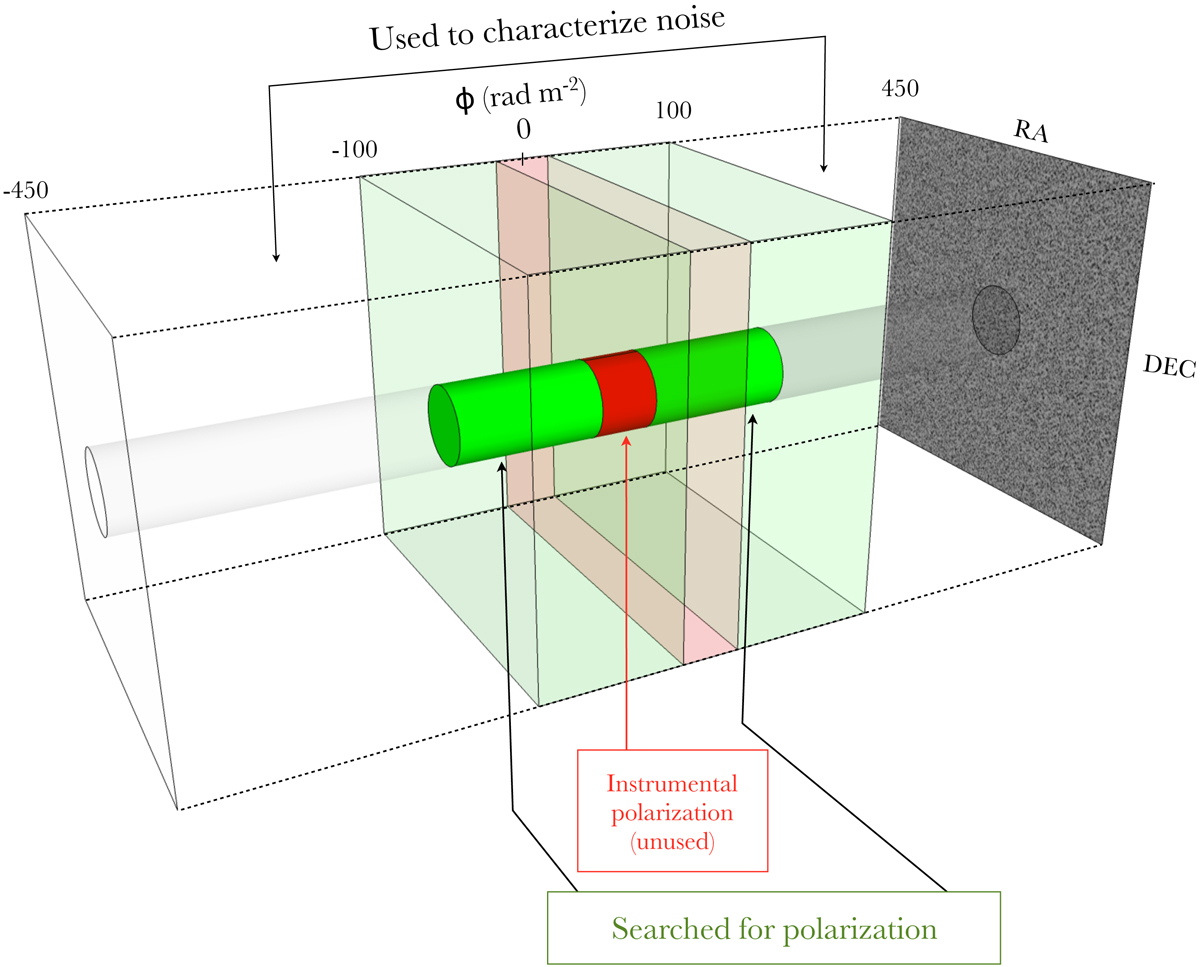
Illustration of the different regions used in the analysis of a Faraday cube. The green cylinders represent the region searched for polarization (at Faraday depth |ϕ| < 100 rad m−2 and outside the central region that is contaminated by instrumental effects). The outer regions (100 rad m−2 < |ϕ| < 450 rad m−2) were used to characterize the noise. The images have a size of 3′ × 3′.
Current usage metrics show cumulative count of Article Views (full-text article views including HTML views, PDF and ePub downloads, according to the available data) and Abstracts Views on Vision4Press platform.
Data correspond to usage on the plateform after 2015. The current usage metrics is available 48-96 hours after online publication and is updated daily on week days.
Initial download of the metrics may take a while.