Fig. 11.
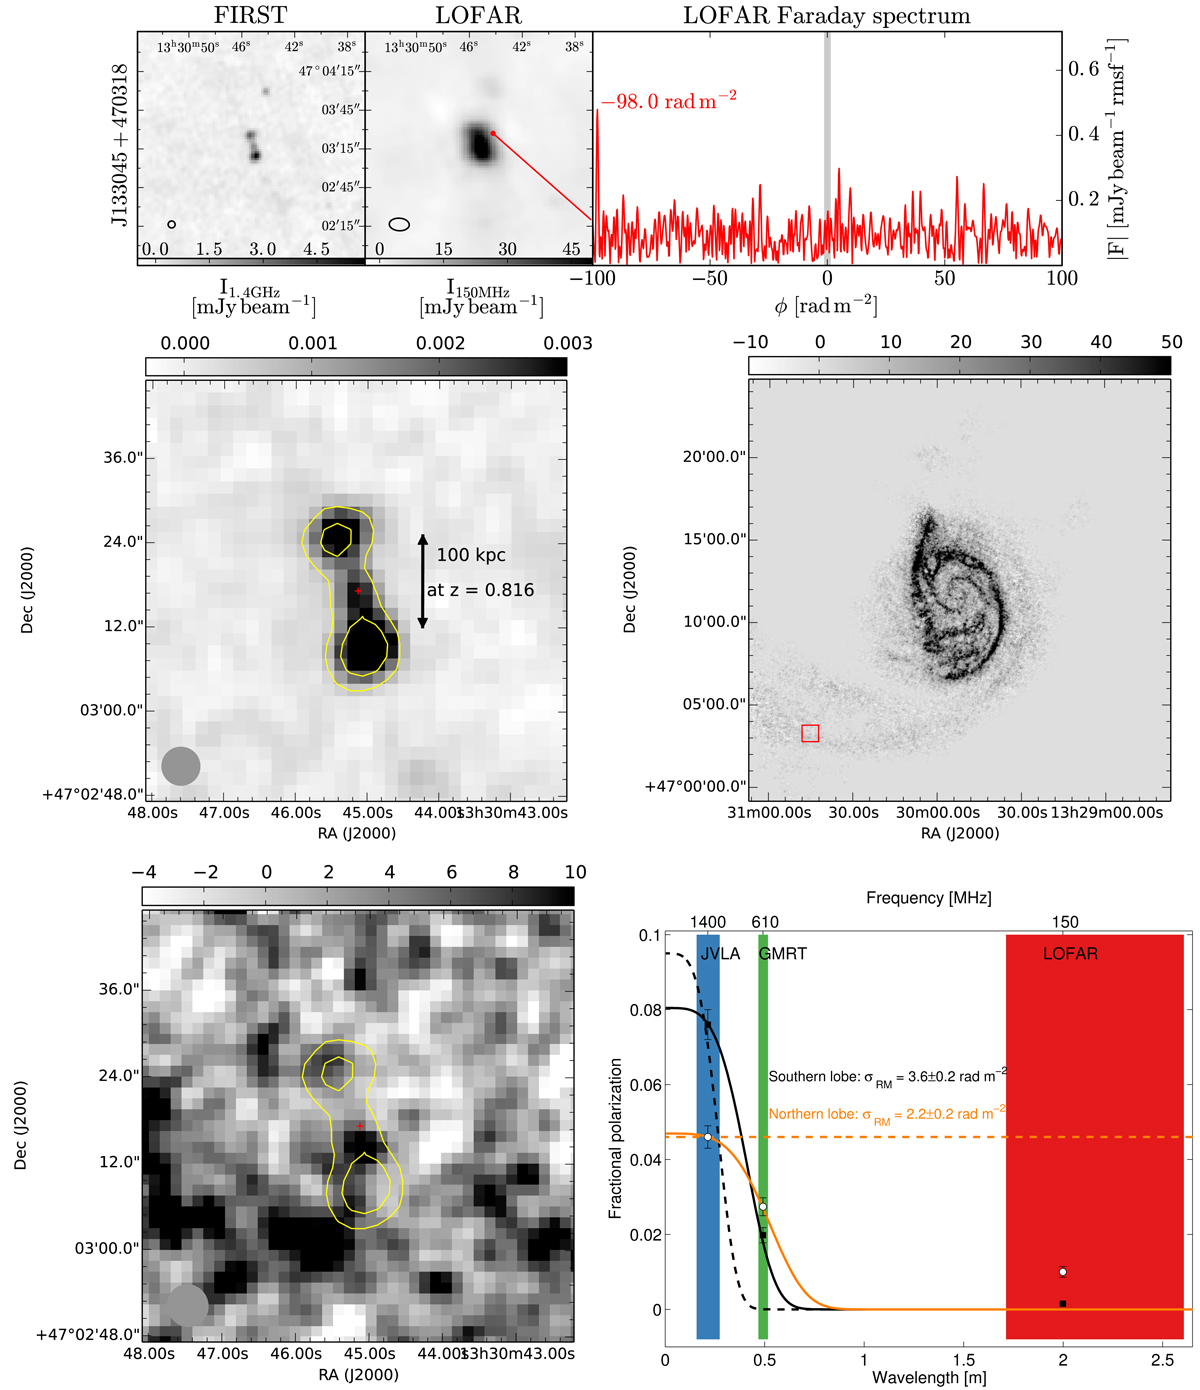
Top row: same subfigures as in Fig. 2, for Source 7. The grey shading around ϕ = 0 shows the region of instrumental polarization that was excluded from the analysis (Sect. 4.4). Second row, left panel: (1′ × 1′) FIRST 1.4 GHz image of our Source 7 in grey scale and in contours (1 and 3 mJy beam−1). The red cross indicates the location of the optical counterpart to the radio core. The color scale ranges from −0.3 to 3 mJy beam−1 and the angular resolution is 5″, as indicated by the grey circle in the bottom left corner. Second row, right panel: H I integrated intensity (moment 0) image of M 51 from THINGS. The red square has a size of 1′ × 1′ and indicates the location of Source 7, the radio galaxy displayed in the previous panel. The grey scale is in Jy beam−1 M s−1. Third row, left panel: zoom of the previous image: (1′ × 1′) H I high-resolution (5.8″ × 5.5″) moment 0 image in grey scale. The yellow contours are the same radio contours of the FIRST image shown in the top left panel. Third row, right panel: measurements of the fractional polarization in the northern radio lobe of Source 7 (white circles) and the southern lobe (black squares). The dashed lines show the depolarization models that best fit the high-frequency data (JVLA 1–2 GHz, Mao et al. 2015) and the solid lines depolarization models that match the averaged 1–2 GHz measurements and the GMRT 610 MHz of Farnes et al. (2013). The LOFAR measurements are not used to constrain the models.
Current usage metrics show cumulative count of Article Views (full-text article views including HTML views, PDF and ePub downloads, according to the available data) and Abstracts Views on Vision4Press platform.
Data correspond to usage on the plateform after 2015. The current usage metrics is available 48-96 hours after online publication and is updated daily on week days.
Initial download of the metrics may take a while.