Fig. 10.
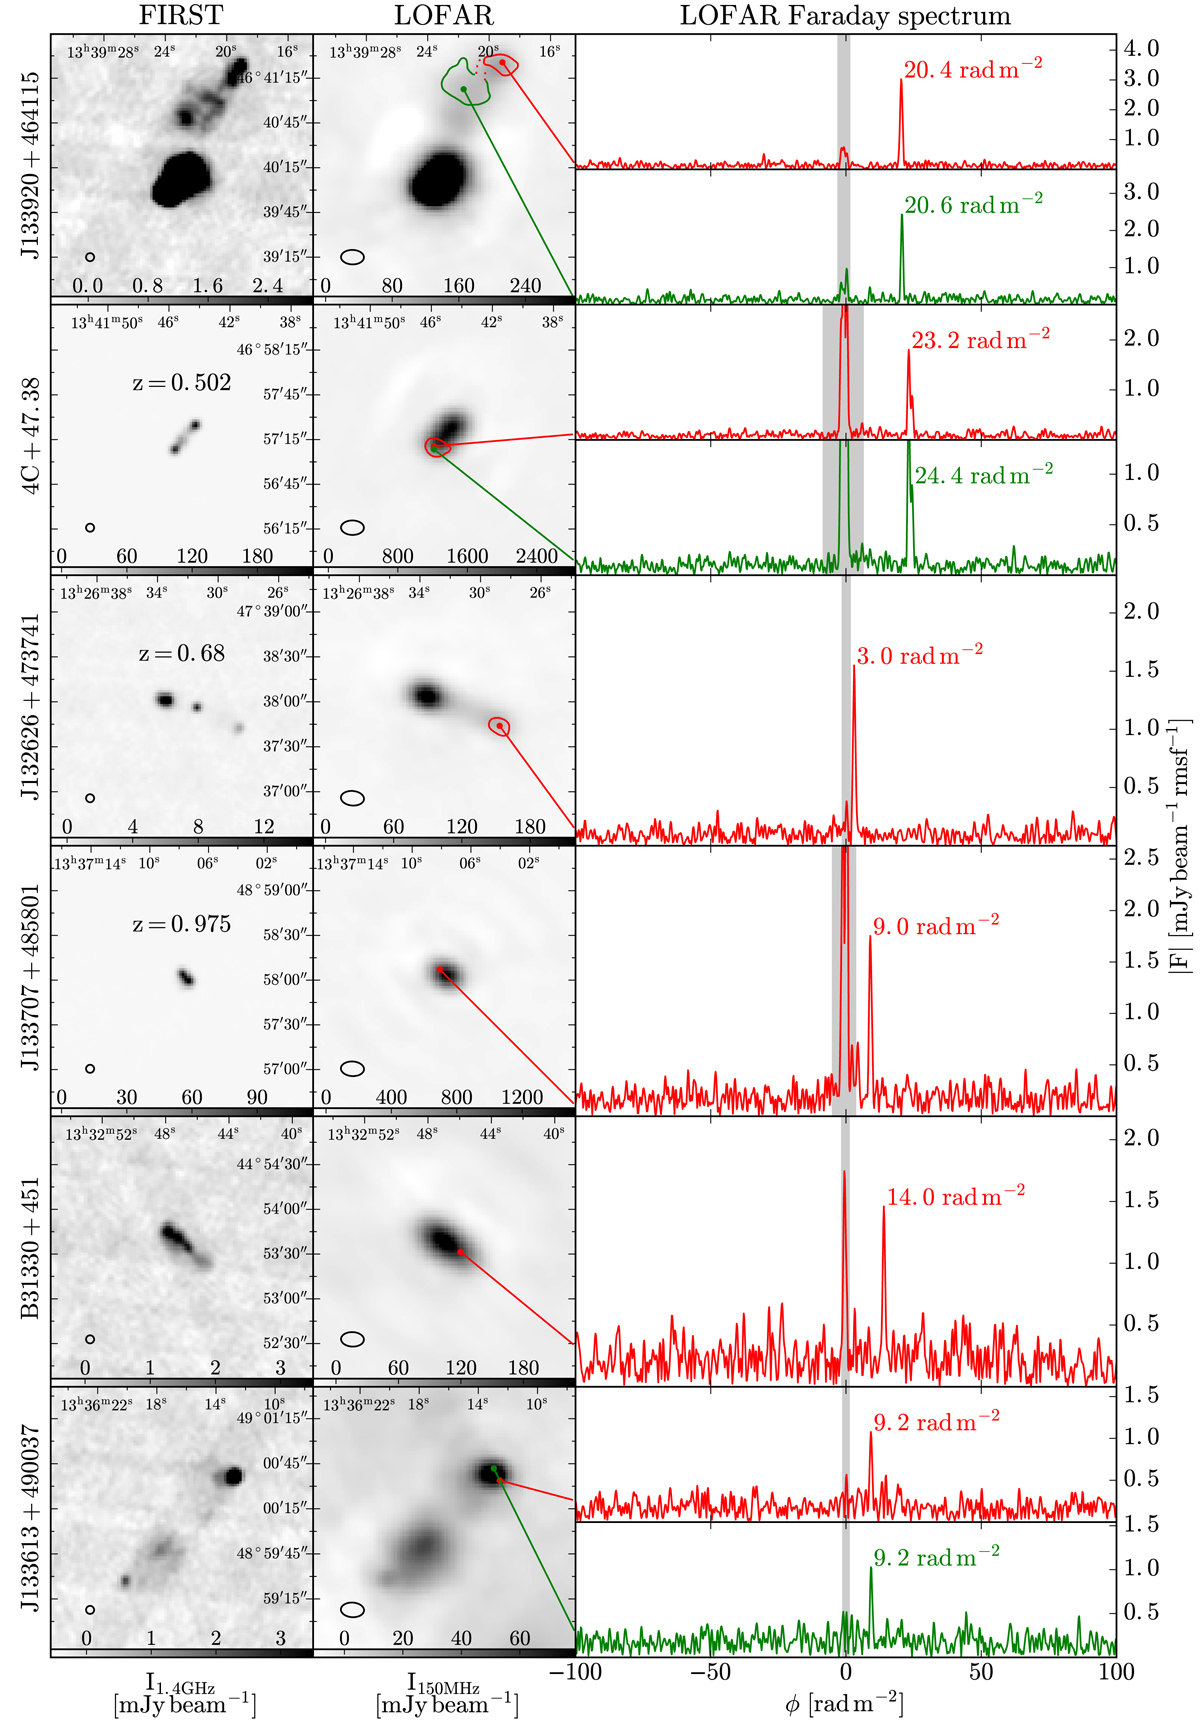
The six sources detected in polarization in the LOFAR 150 MHz data with a 5% false discovery rate. Left and middle column: 3′ × 3′ VLA FIRST 1.4 GHz images (5″ resolution; Becker et al. 1995) and LOFAR 150 MHz images. The synthesized beams of the images are displayed in the bottom left corners. Right column: LOFAR Faraday spectra at the most highly polarized location. The contours correspond to the FWHM of the peak in polarized intensity; they were omitted when their shape was significantly affected by noise. The red and green colors are used to show Faraday spectra at two nearby locations in the same source. The grey shading around ϕ = 0 shows the region of instrumental polarization that was excluded from the analysis (Sect. 4.4).
Current usage metrics show cumulative count of Article Views (full-text article views including HTML views, PDF and ePub downloads, according to the available data) and Abstracts Views on Vision4Press platform.
Data correspond to usage on the plateform after 2015. The current usage metrics is available 48-96 hours after online publication and is updated daily on week days.
Initial download of the metrics may take a while.