Fig. 4
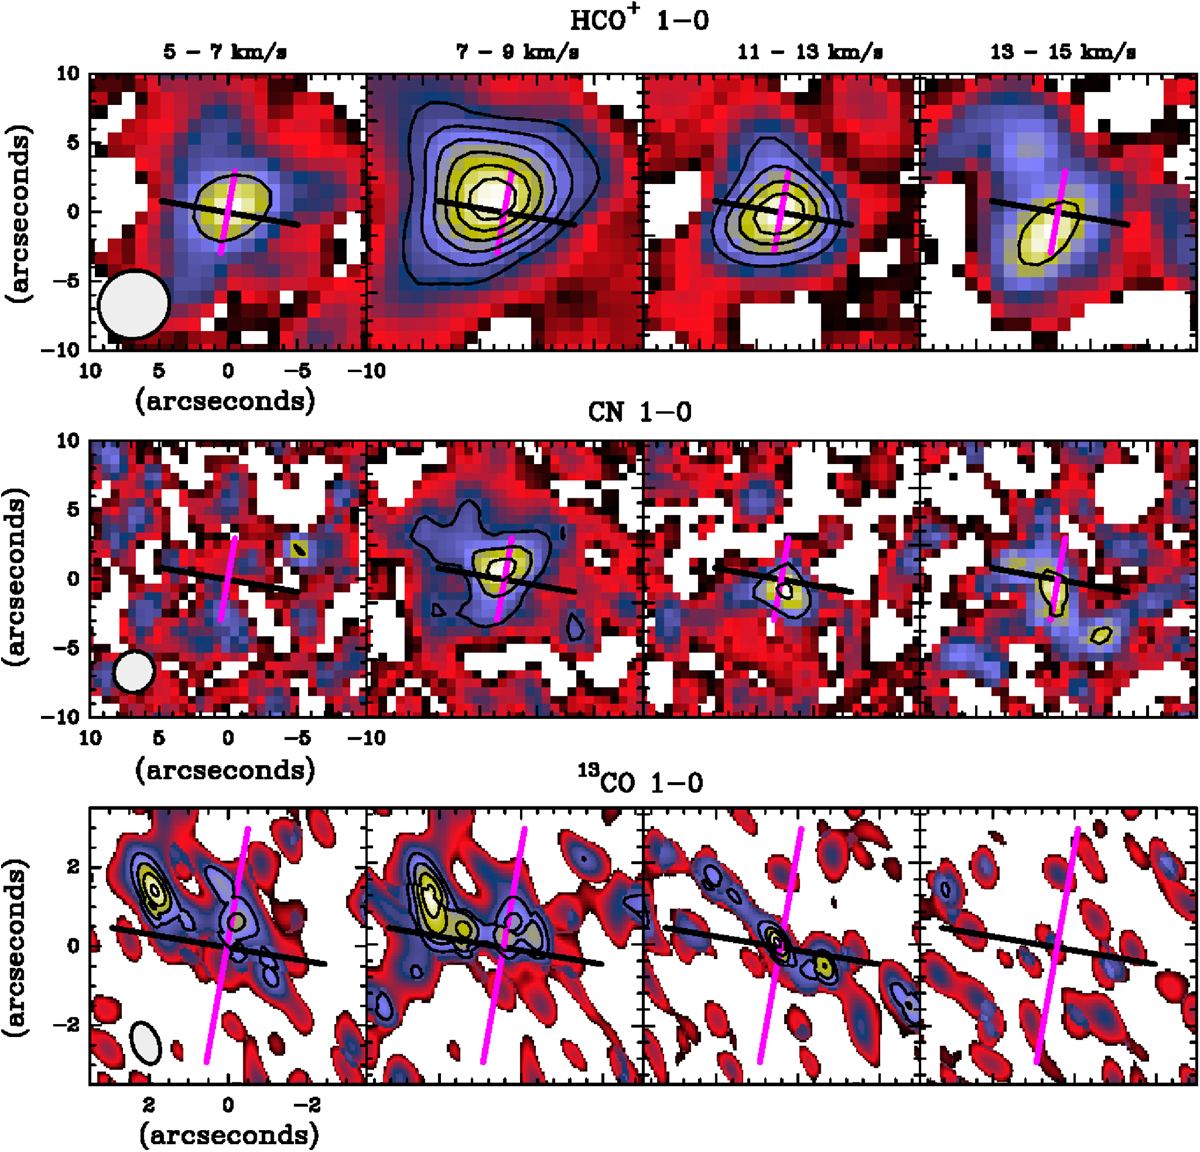
Integrated intensity maps of the HCO+ J = 1 →0, CN N = 1 →0 (J, F = 3/5,5/2 →1/3,3/2), and 13CO J = 1 →0 lines in various velocity intervals. We have avoided the central velocites (9−11 km s−1) for which the space filtering effects are expected important. Contour levels are 0.03 to 0.4 in steps of 0.015 Jy × km s−1 (top panel); 0.02 to 0.12 in steps of 0.02 Jy × km s−1 (middle panel); 0.03 to 0.12 in steps of 0.01 Jy × km s−1 (bottom panel). The orientation of the molecular emission is approximately perpendicular to the magenta arrow that indicates the direction of the outflow. The black line indicates the disk major axis orientation. The ellipse in the left bottom corner indicates the synthesized beam size.
Current usage metrics show cumulative count of Article Views (full-text article views including HTML views, PDF and ePub downloads, according to the available data) and Abstracts Views on Vision4Press platform.
Data correspond to usage on the plateform after 2015. The current usage metrics is available 48-96 hours after online publication and is updated daily on week days.
Initial download of the metrics may take a while.