Fig. 1.
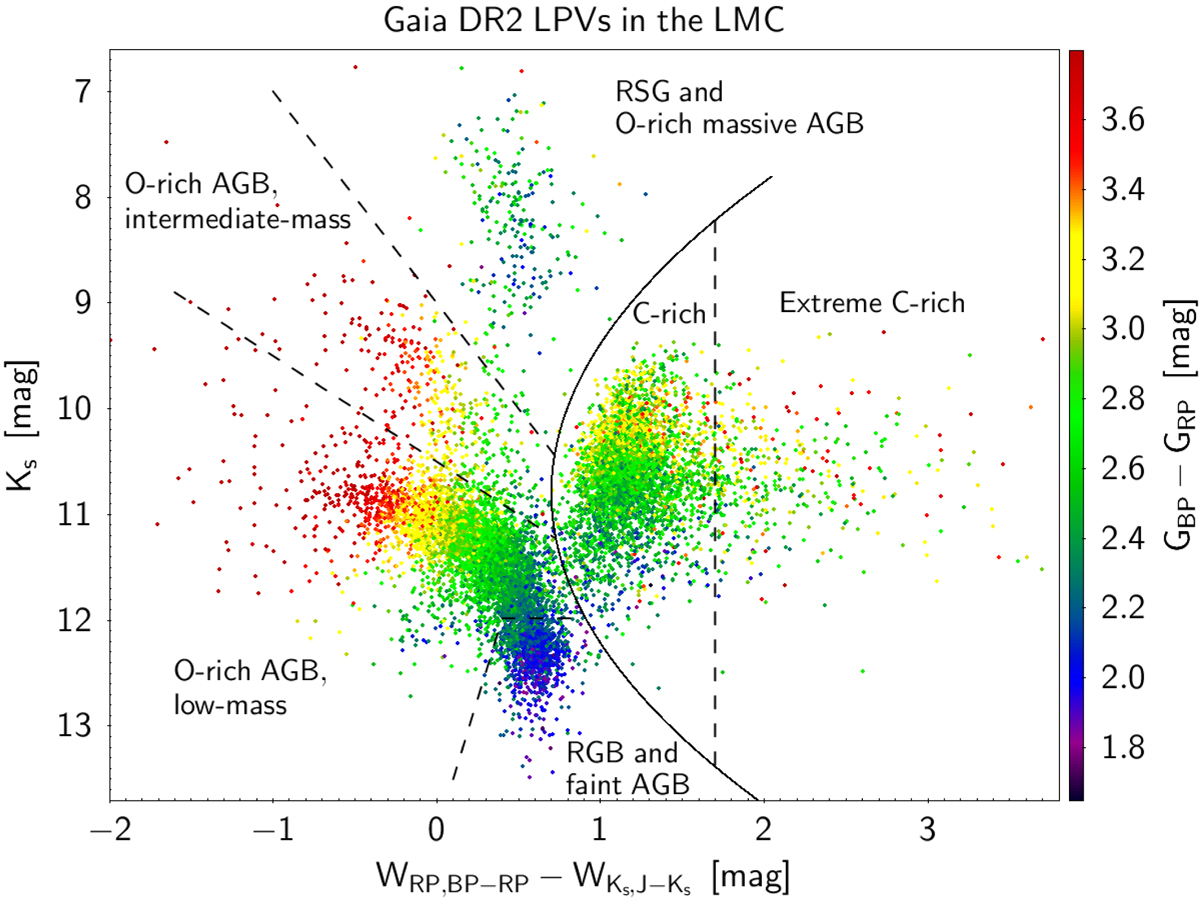
(WRP, BP−RP − WKs, J−Ks) vs. Ks diagram of Gaia DR2 LPVs in the LMC. The markers are colored with GBP − GRP according to the color-scale shown on the right of the figure. The solid line delineates O-rich (left of the line) and C-rich (right of the line) stars, and dashed lines delineate sub-groups as indicated in the figure. The definition of the borderlines are given in Appendix A.
Current usage metrics show cumulative count of Article Views (full-text article views including HTML views, PDF and ePub downloads, according to the available data) and Abstracts Views on Vision4Press platform.
Data correspond to usage on the plateform after 2015. The current usage metrics is available 48-96 hours after online publication and is updated daily on week days.
Initial download of the metrics may take a while.