Fig. 3.
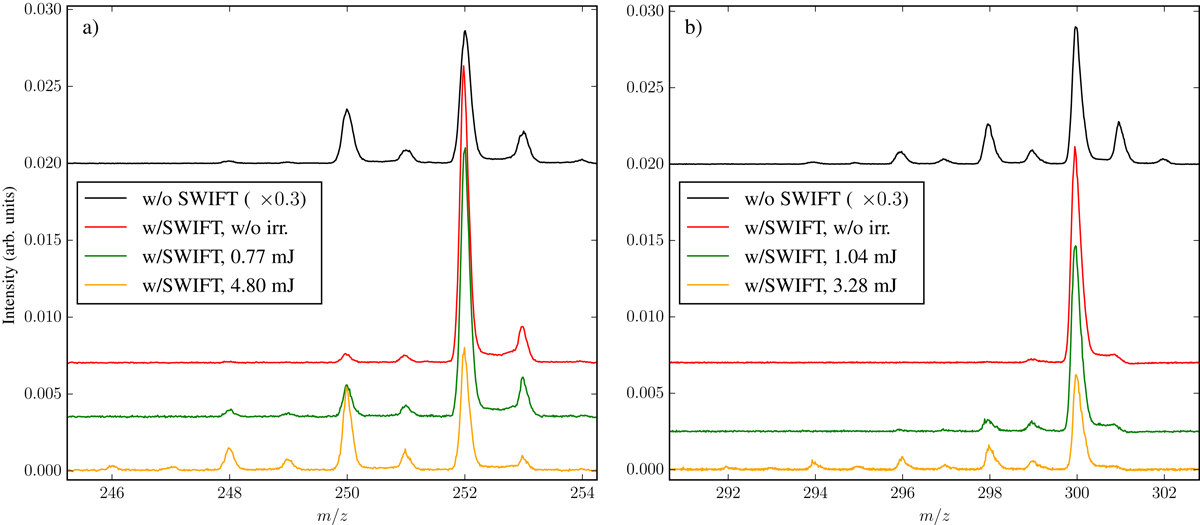
Comparison of the mass spectra of perylene (left panels) and coronene (right panels) for different experimental conditions. In black is the spectrum before the SWIFT pulse and without irradiation, which shows electron induced fragmentation (intensity is scaled by 0.3). In red is the SWIFTed and non-irradiated mass spectrum. The green and yellow traces show the mass spectra, after SWIFT pulse and irradiation, for representative low and high laser energy, respectively.
Current usage metrics show cumulative count of Article Views (full-text article views including HTML views, PDF and ePub downloads, according to the available data) and Abstracts Views on Vision4Press platform.
Data correspond to usage on the plateform after 2015. The current usage metrics is available 48-96 hours after online publication and is updated daily on week days.
Initial download of the metrics may take a while.