Fig. 3.
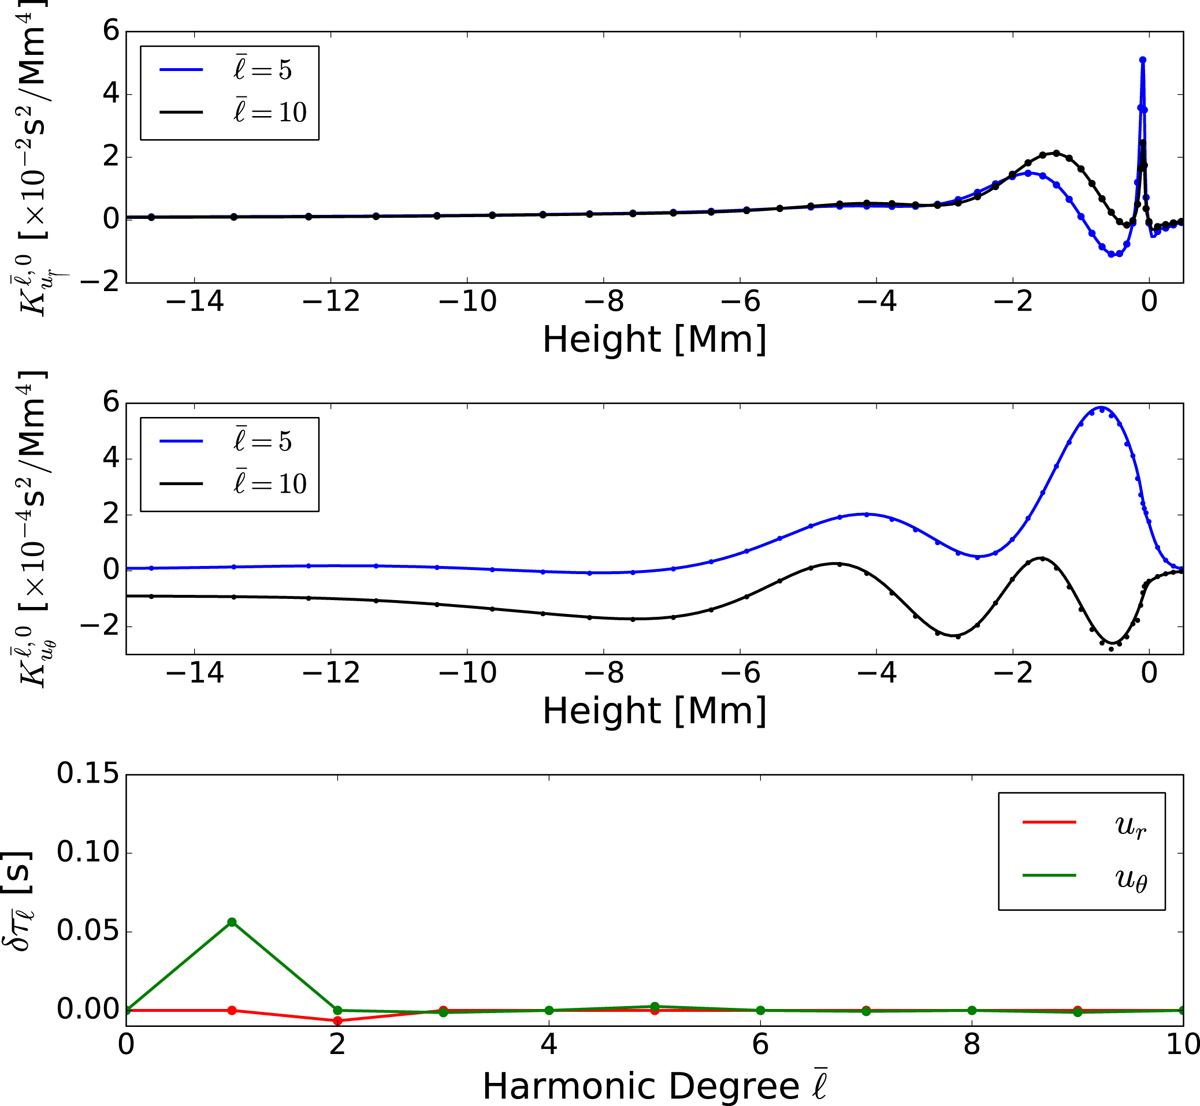
Top and middle panels: comparison of the kernels for ![]() and 10 (blue and black, respectively) computed using the method here (solid lines) and the method of Gizon et al. (2017; dots). Bottom panel: travel times
and 10 (blue and black, respectively) computed using the method here (solid lines) and the method of Gizon et al. (2017; dots). Bottom panel: travel times ![]() due to the radial (red) and the latitudinal (green) components of the flow for each
due to the radial (red) and the latitudinal (green) components of the flow for each ![]() of the kernels presented here (solid line) and those of Gizon et al. (2017; dots).
of the kernels presented here (solid line) and those of Gizon et al. (2017; dots).
Current usage metrics show cumulative count of Article Views (full-text article views including HTML views, PDF and ePub downloads, according to the available data) and Abstracts Views on Vision4Press platform.
Data correspond to usage on the plateform after 2015. The current usage metrics is available 48-96 hours after online publication and is updated daily on week days.
Initial download of the metrics may take a while.