Fig. 9
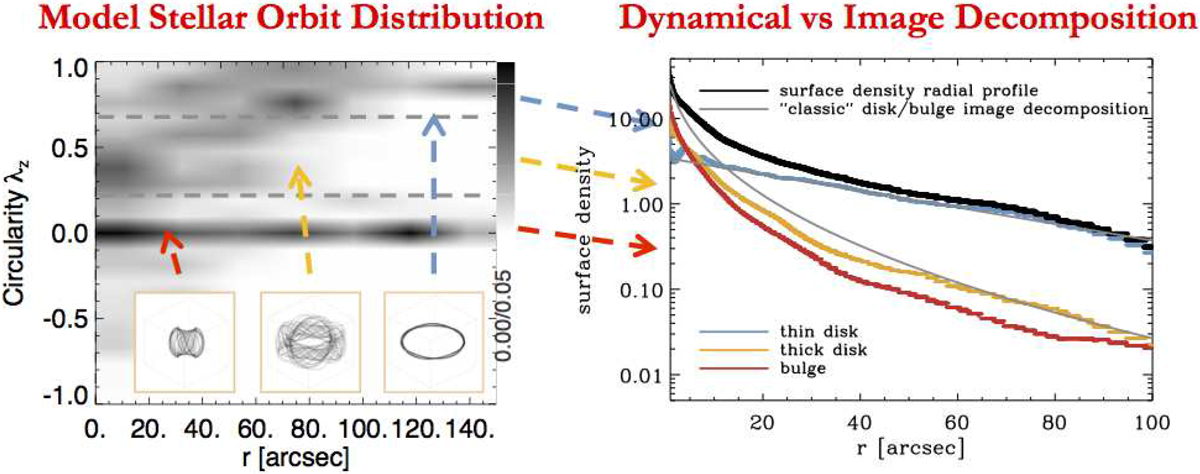
Orbital and photometric decomposition of FCC 167. Left panel: orbit distribution in the phase space of circularity λZ vs. intrinsic radius r, as derived from the best-fitting orbit-superposition model shown in Fig. 8. Grey-scale colours indicate the orbital density in phase space. The horizontal dashed lines separate stars in highly-circular cold thin-disc orbits (λZ > 0.7) from those following dynamically warm thick-disc motions (0.2 < λZ < 0.7) and those in the non-rotating bulge and stellar halo (λZ ~ 0). Right panel:stellar surface-density profiles of FCC 167. The grey lines trace the profiles of a classical exponential disc and Sérsic bulge as derived from a standard bulge-disc decomposition, whereas the blue, orange, and red lines follow the projected surface brightness of the dynamically cold, warm (thick disc), and hot (bulge) components, respectively.
Current usage metrics show cumulative count of Article Views (full-text article views including HTML views, PDF and ePub downloads, according to the available data) and Abstracts Views on Vision4Press platform.
Data correspond to usage on the plateform after 2015. The current usage metrics is available 48-96 hours after online publication and is updated daily on week days.
Initial download of the metrics may take a while.