Fig. 6
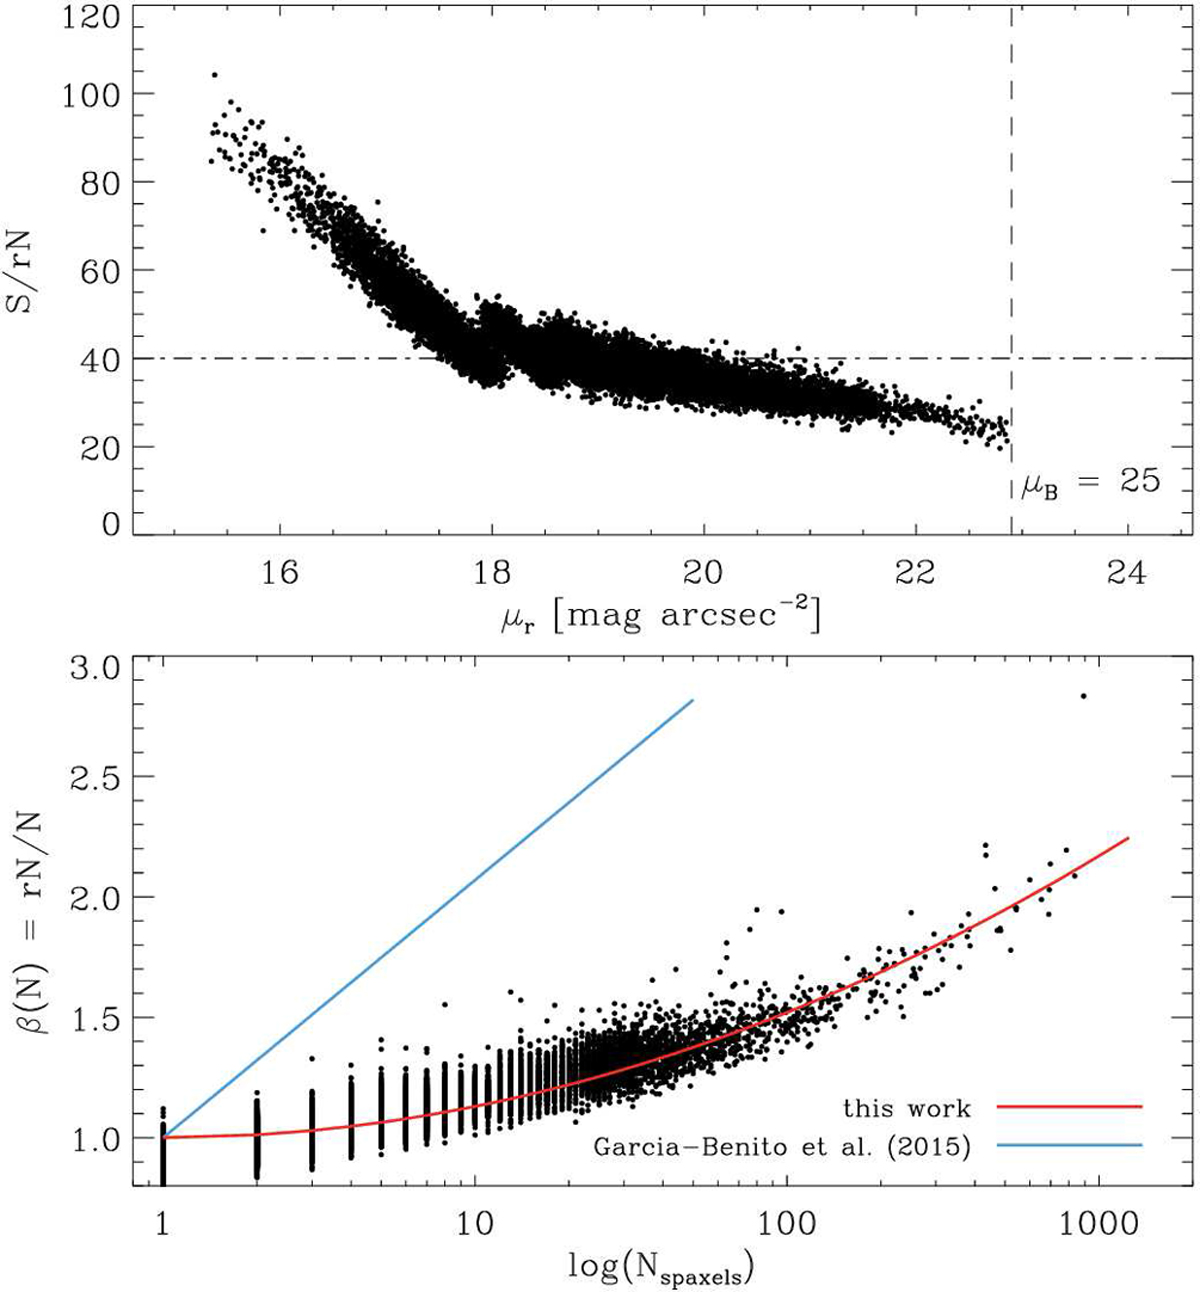
Top panel: quality of the Voronoi-binned spectra for a target S∕N = 40 as a functionof r-band surface brightness in MUSE data of FCC 167. The S/rN ratio between the median value of the flux and the noise level in the fit residuals is used as a more conservative measure of the spectral quality. Lower panel: level of spatial correlation in the MUSE data of FCC 167. The covariance ratio β = rN∕N between the fit residual noise and the formally propagated noise increases as function of bin size (or number ofspaxels) in each Voronoi bin, although much less than in the CALIFA data (blue line). The β trend is well described by a quadratic form in logNspaxels (red line).
Current usage metrics show cumulative count of Article Views (full-text article views including HTML views, PDF and ePub downloads, according to the available data) and Abstracts Views on Vision4Press platform.
Data correspond to usage on the plateform after 2015. The current usage metrics is available 48-96 hours after online publication and is updated daily on week days.
Initial download of the metrics may take a while.