Fig. 5
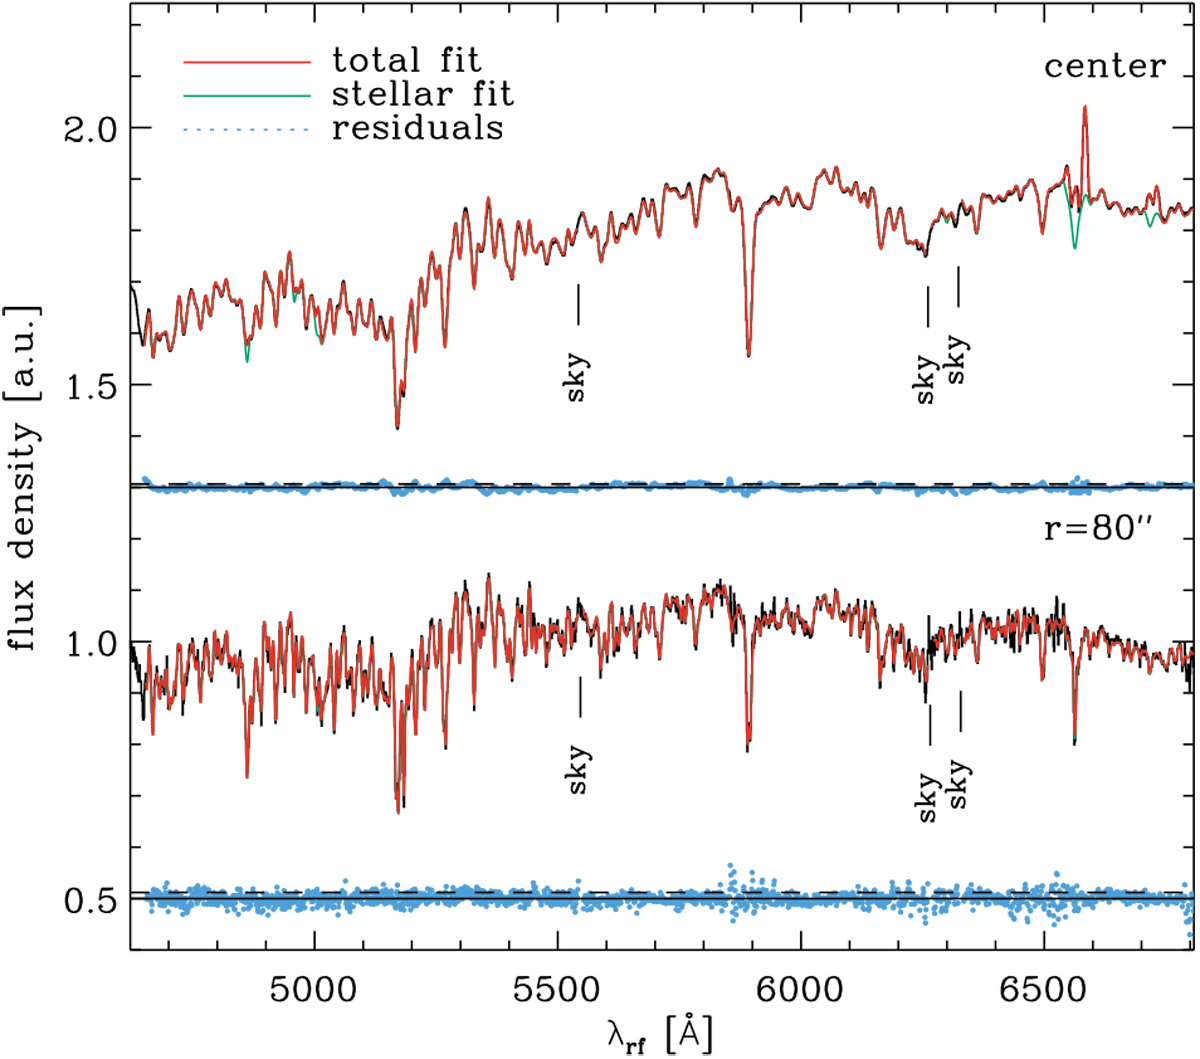
GandALF fits to the central (top panel) and outer aperture (bottom panel) spectra extracted from the MUSE data of FCC 167 (see Fig. 4). To allow a more direct comparison between these two spectra (black lines) and their respective GandALF fits (green and red lines), both data and models were normalised and rescaled. The residuals obtained by subtracting the model from the spectrum are also shown (bluepoints). These models used the entire MILES (Blasquez et al. 2006) stellar library as stellar templates to achieve the best possible fit. At the same time, to ensure a physically-motivated model only reddening by dust was used to adjust the templates to the observed shape of the stellar continuum. The position of the most prominent [O I] sky emission lines is indicated.
Current usage metrics show cumulative count of Article Views (full-text article views including HTML views, PDF and ePub downloads, according to the available data) and Abstracts Views on Vision4Press platform.
Data correspond to usage on the plateform after 2015. The current usage metrics is available 48-96 hours after online publication and is updated daily on week days.
Initial download of the metrics may take a while.