Fig. 4
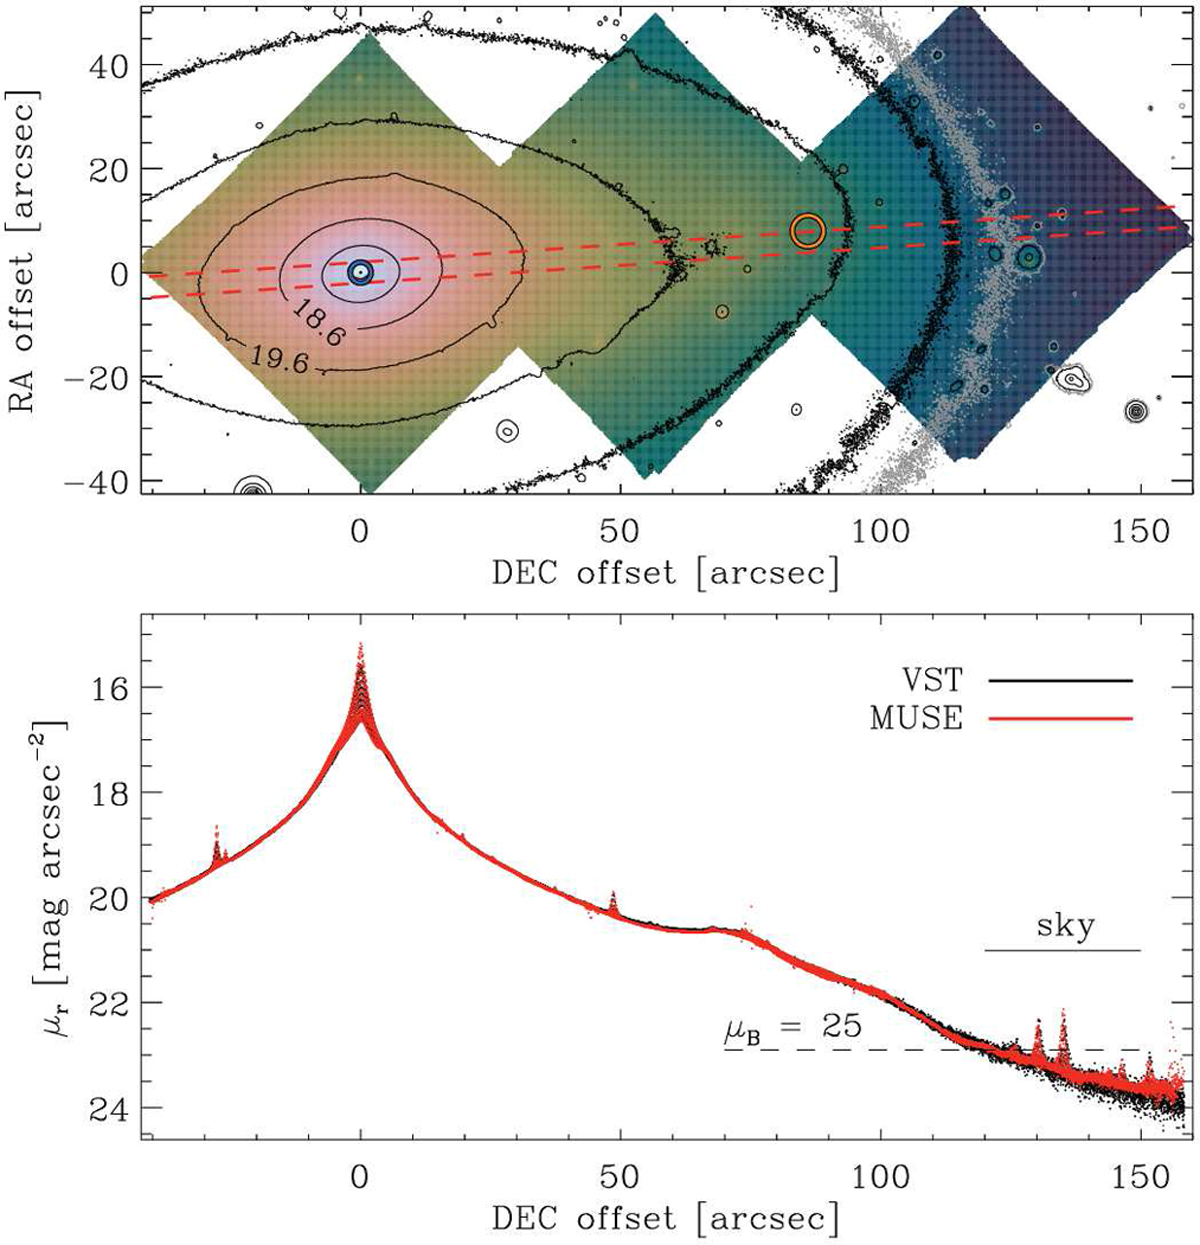
Top panel: MUSE reconstructed image of the combined mosaic of FCC 167 compared with isophotes of the r-band VST image shown in Fig. 3. The black isophotes cover the range between μr = 16.6 and 22.6 mag arcsec−2 and are spaced by 1 mag arcsec−2. The grey isophote corresponds to μB = 25 mag arcsec−2. The blue and orange circles indicate, respectively, the position of the central and outer apertures selected for testing the spectral quality of the F3D data (see Fig. 5). The red dashed lines mark the 2 arcsec wide aperture along the galaxy major axis (P.A. = 3.9°) where the surface-brightness radial profile plotted in the bottom panel was extracted. Bottom panel: surface-brightness radial profile along the major axis of FCC 167 from the MUSE reconstructed image (red points) and r-band VST image (black points). The sky level of MUSE (horizontal continuous line) and μB = 25 mag arcsec−2 (horizontal dashed line) are shown for comparison.
Current usage metrics show cumulative count of Article Views (full-text article views including HTML views, PDF and ePub downloads, according to the available data) and Abstracts Views on Vision4Press platform.
Data correspond to usage on the plateform after 2015. The current usage metrics is available 48-96 hours after online publication and is updated daily on week days.
Initial download of the metrics may take a while.