Fig. 2
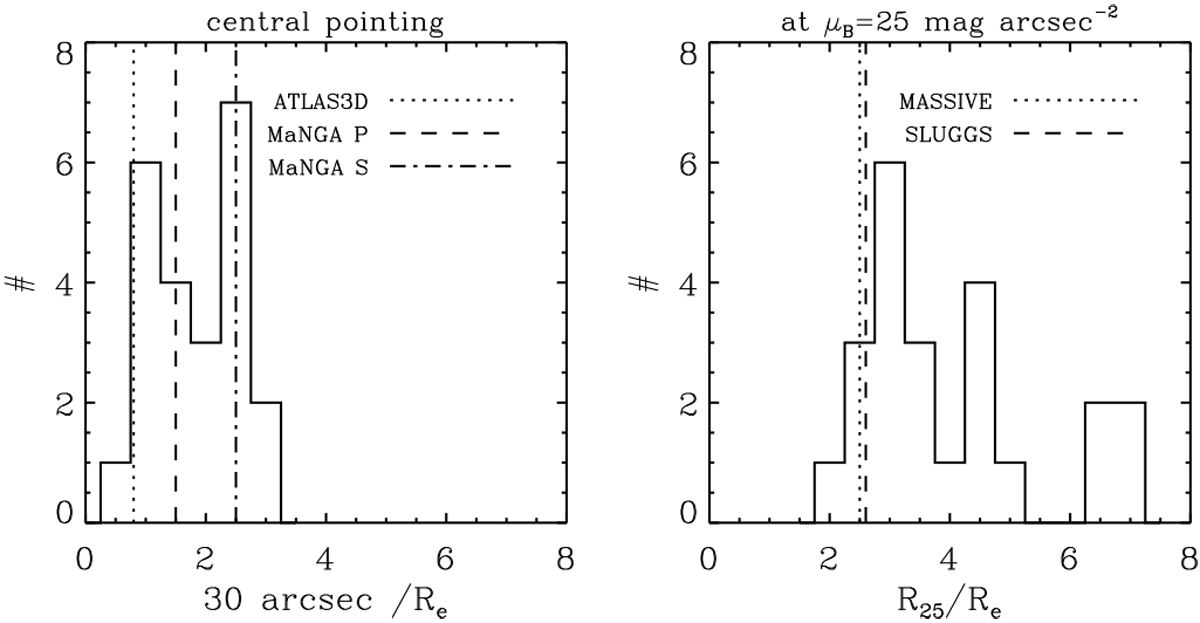
Left panel: spatial coverage of the MUSE central pointings of the F3D ETGs in units of 30 arcsec ∕Re (histogram) compared to the ATLAS3D (Cappellari et al. 2011; dotted line) and MaNGA (Bundy et al. 2015; primary sample: dashed line, secondary sample: dash-dotted line) surveys. Right panel: spatial coverage of the MUSE halo pointings of the F3D ETGs down to μB = 25 mag arcsec−2 in units of R25∕Re (histogram) compared to the MASSIVE (Greene et al. 2015, dotted line) and SLUGGS (Foster et al. 2016, dashed line) surveys.
Current usage metrics show cumulative count of Article Views (full-text article views including HTML views, PDF and ePub downloads, according to the available data) and Abstracts Views on Vision4Press platform.
Data correspond to usage on the plateform after 2015. The current usage metrics is available 48-96 hours after online publication and is updated daily on week days.
Initial download of the metrics may take a while.