Fig. 18
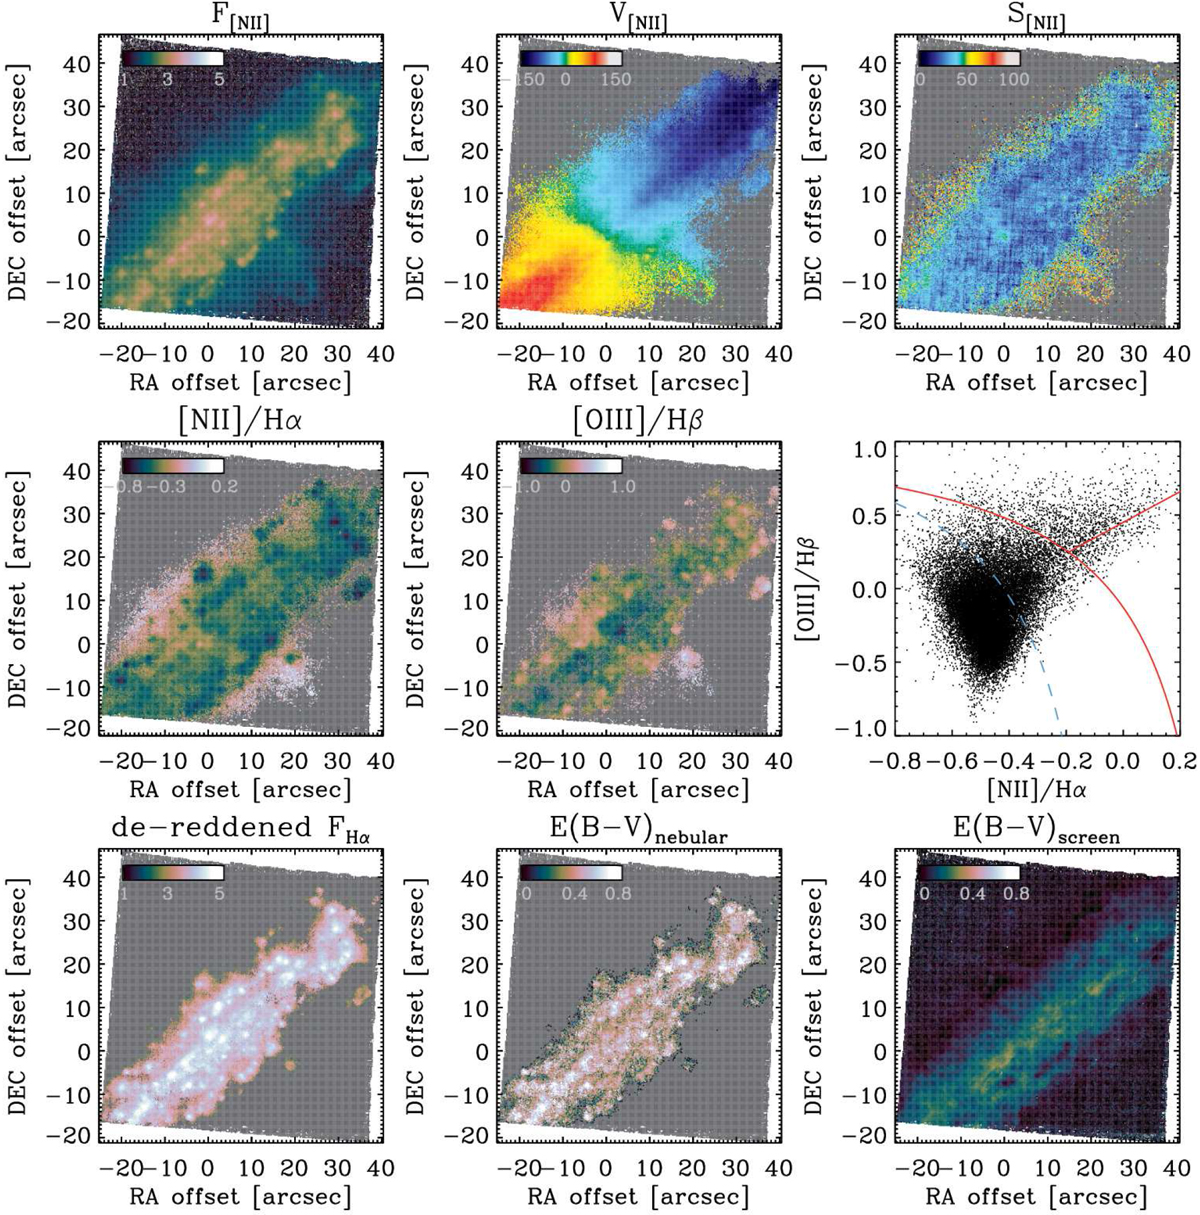
Emission-line analysis for the central regions of FCC 312. Top panels: maps of the total flux, mean velocity and velocity dispersion along the line-of-sight from the [N II]λ6583 nebular emission. Middle panels: maps of the [N II]λ6583/Hα and [O III]λ5007/Hβ line ratios and corresponding BPT diagram. Bottom panels: maps of the de-reddened Hα flux, extinction on the nebular lines, and extinction derived from the stellar continuum. Velocities and velocity dispersions are in km s−1, reddening values are in magnitude, line ratios and fluxes are shown in a logarithmic scales, with the latter in units of 10−20 erg cm−2 s−1. Grey areas in the maps refer to regions where the S/N of the relevant lines was not sufficiently elevated to firmly exclude a false positive detection. These levels were established in regions devoid of emission well above and below the equatorial plane of the galaxy.
Current usage metrics show cumulative count of Article Views (full-text article views including HTML views, PDF and ePub downloads, according to the available data) and Abstracts Views on Vision4Press platform.
Data correspond to usage on the plateform after 2015. The current usage metrics is available 48-96 hours after online publication and is updated daily on week days.
Initial download of the metrics may take a while.