Free Access
Fig. 16
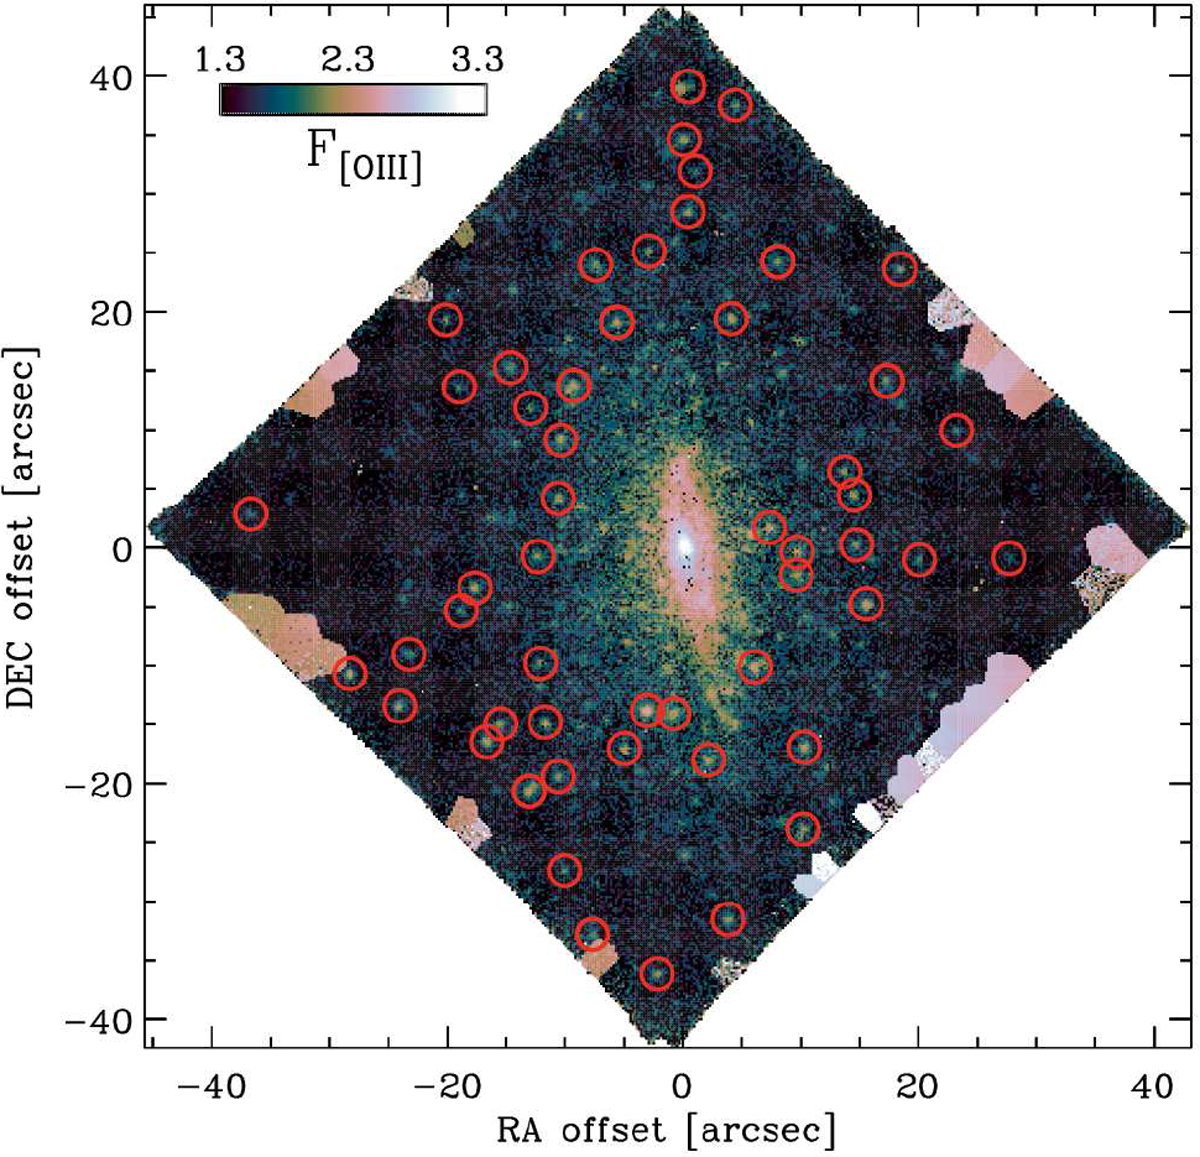
Map of the flux of the [O III]λ5007 emission from the central pointing of FCC 167. The extended disc is clearly visible. The detected planetary nebulae are indicated by red circles. [O III]λ5007 flux values are shown on a logarithmic scale and in 10−20 erg cm−2 s−1.
Current usage metrics show cumulative count of Article Views (full-text article views including HTML views, PDF and ePub downloads, according to the available data) and Abstracts Views on Vision4Press platform.
Data correspond to usage on the plateform after 2015. The current usage metrics is available 48-96 hours after online publication and is updated daily on week days.
Initial download of the metrics may take a while.