Fig. 15
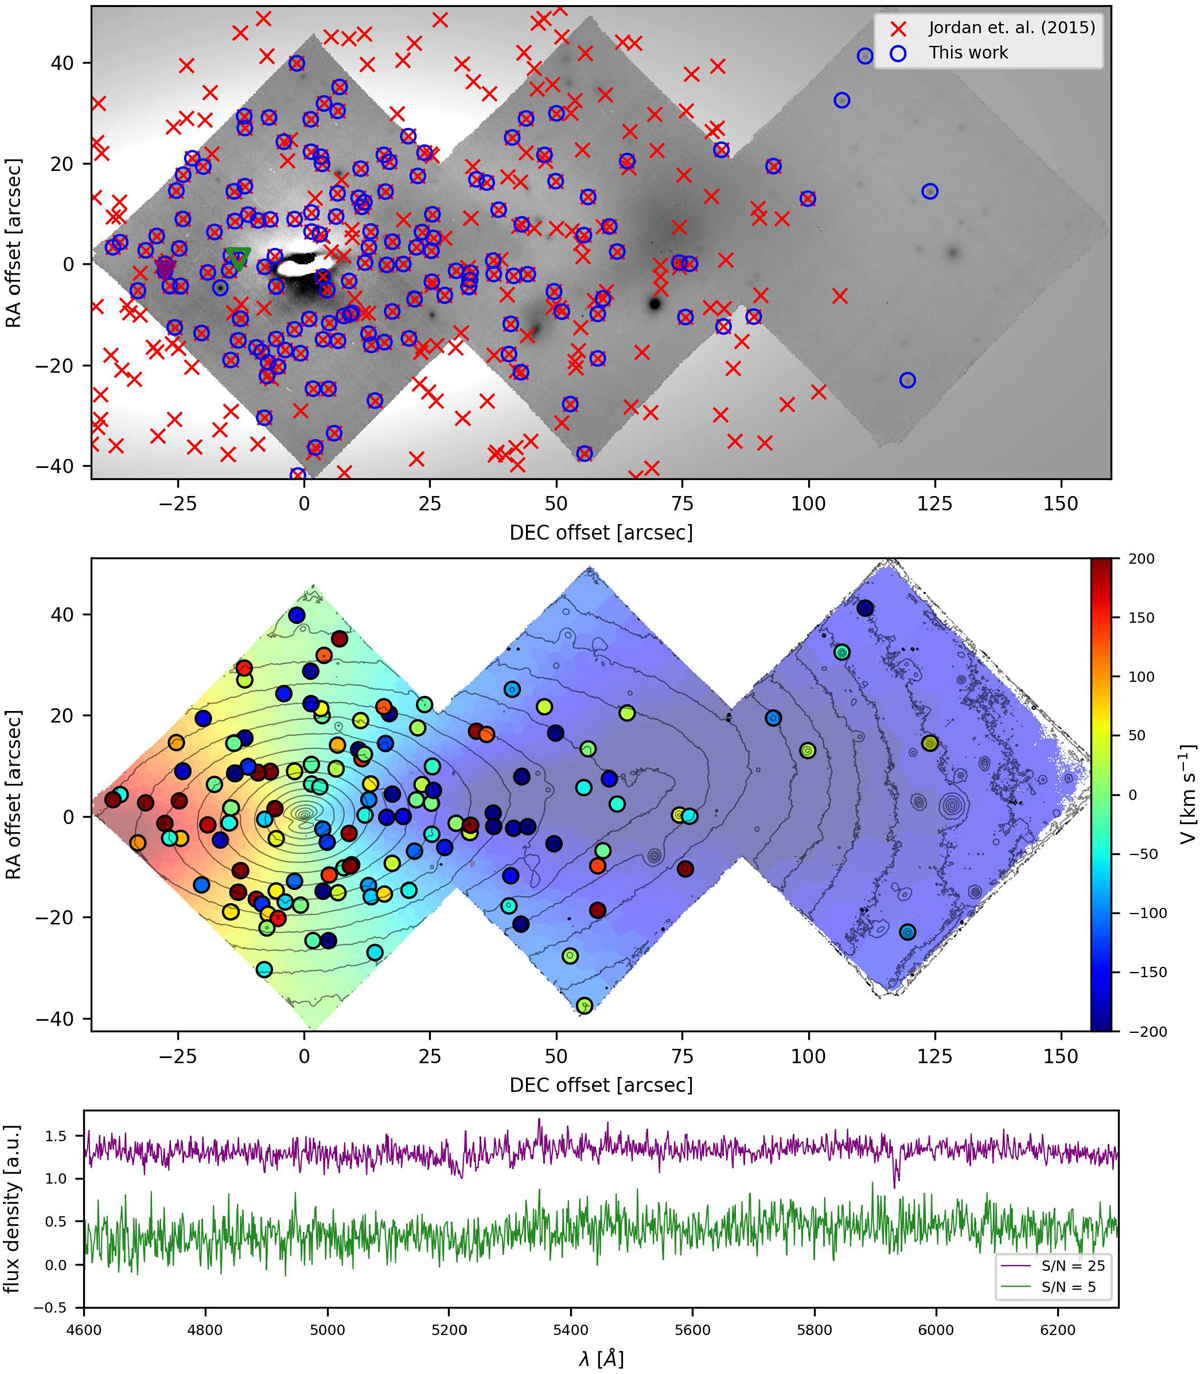
Illustration of GC extraction from MUSE data of FCC 167. Top panel: residual image obtained by subtractingthe IMFIT surface-brightness model of FCC 167 from the galaxy surface-brightness distribution extracted from MUSE data. The GC candidates from MUSE data (blue circles) and GCs in the HST/ACS GC catalogue (Jordán et al. 2015; red crosses) are shown. Middle panel: map of the mean stellar velocity of FCC 167 shown in Fig. 8 and radial velocities of the GCs. Bottom panel: spectra of two MUSE GCs with S∕N ≈ 25 (purple line) and 5 (green line) whose location is indicated in the top panel by the filled purple and open green triangles, respectively.
Current usage metrics show cumulative count of Article Views (full-text article views including HTML views, PDF and ePub downloads, according to the available data) and Abstracts Views on Vision4Press platform.
Data correspond to usage on the plateform after 2015. The current usage metrics is available 48-96 hours after online publication and is updated daily on week days.
Initial download of the metrics may take a while.