Fig. 14
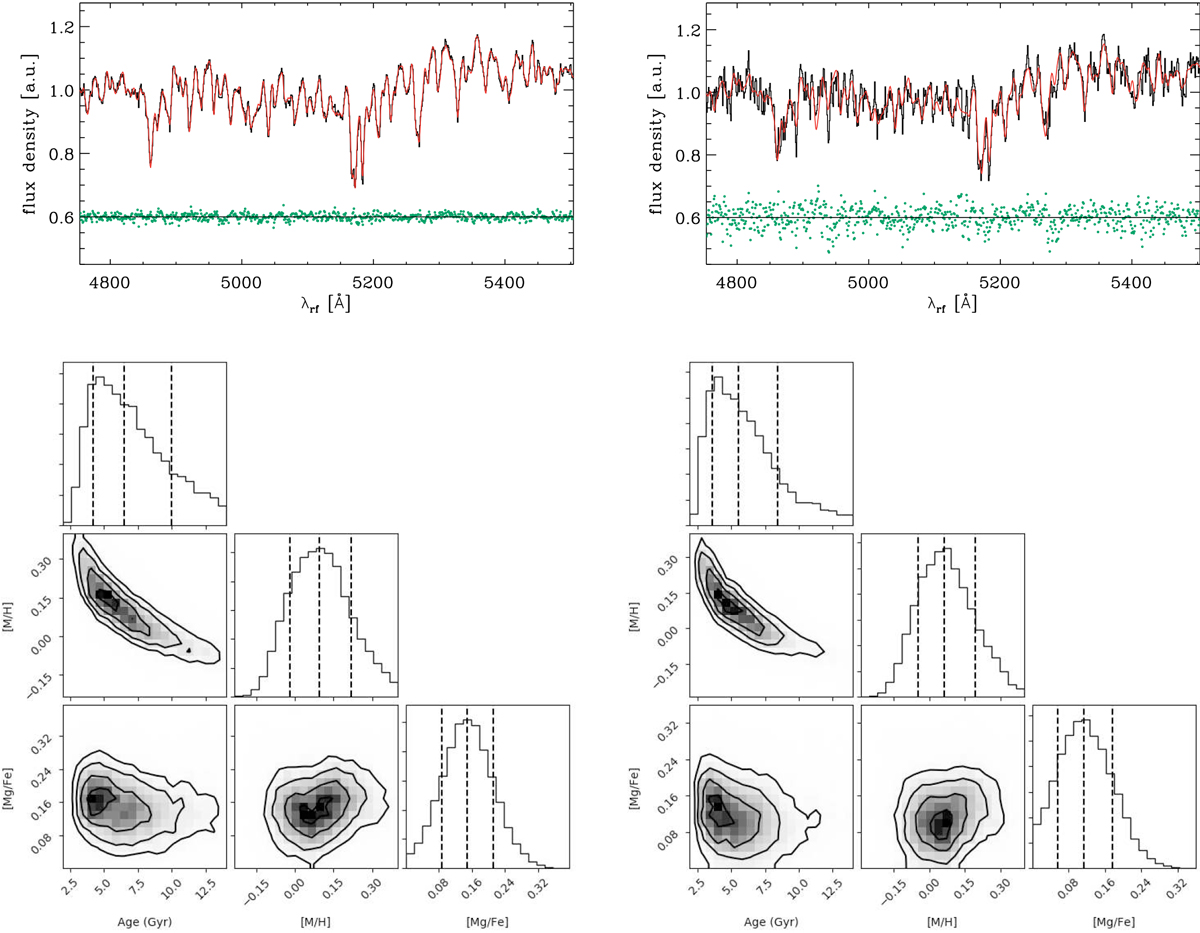
Stellar population properties from the two selected apertures in the middle (left panels) and halo pointing (right panels) of FCC 167 shown in Fig. 13. Top panels: rest-frame spectra (black lines), best-fitting models (red lines), and residuals obtained by subtracting models from spectra (green points). Bottom panels: posterior distributions for the age, metallicity [M/H], and α-element abundance [Mg/Fe]. The dashed lines overplotted on the histograms indicate the 16%, 50%, and 84% percentiles of the marginalised distributions.
Current usage metrics show cumulative count of Article Views (full-text article views including HTML views, PDF and ePub downloads, according to the available data) and Abstracts Views on Vision4Press platform.
Data correspond to usage on the plateform after 2015. The current usage metrics is available 48-96 hours after online publication and is updated daily on week days.
Initial download of the metrics may take a while.