Fig. 13
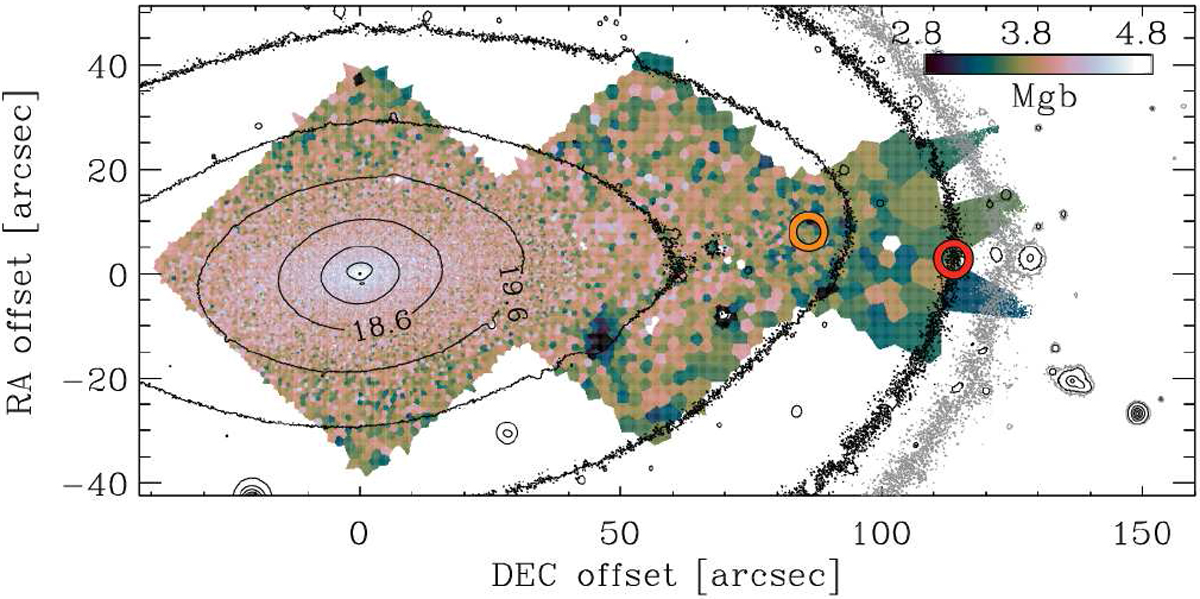
Mg b map of FCC 167 with the r-band isophotes (black lines) and B-band isophote (grey line) shown in Fig. 4. The orange and red circles indicate the location of two selected apertures where the Hβ, Mg b, Fe5270, Fe5335, and Fe5406 line-strength indices were measured and fitted in order to constrain the stellar population properties, as shown in Fig. 14.
Current usage metrics show cumulative count of Article Views (full-text article views including HTML views, PDF and ePub downloads, according to the available data) and Abstracts Views on Vision4Press platform.
Data correspond to usage on the plateform after 2015. The current usage metrics is available 48-96 hours after online publication and is updated daily on week days.
Initial download of the metrics may take a while.