Fig. 11
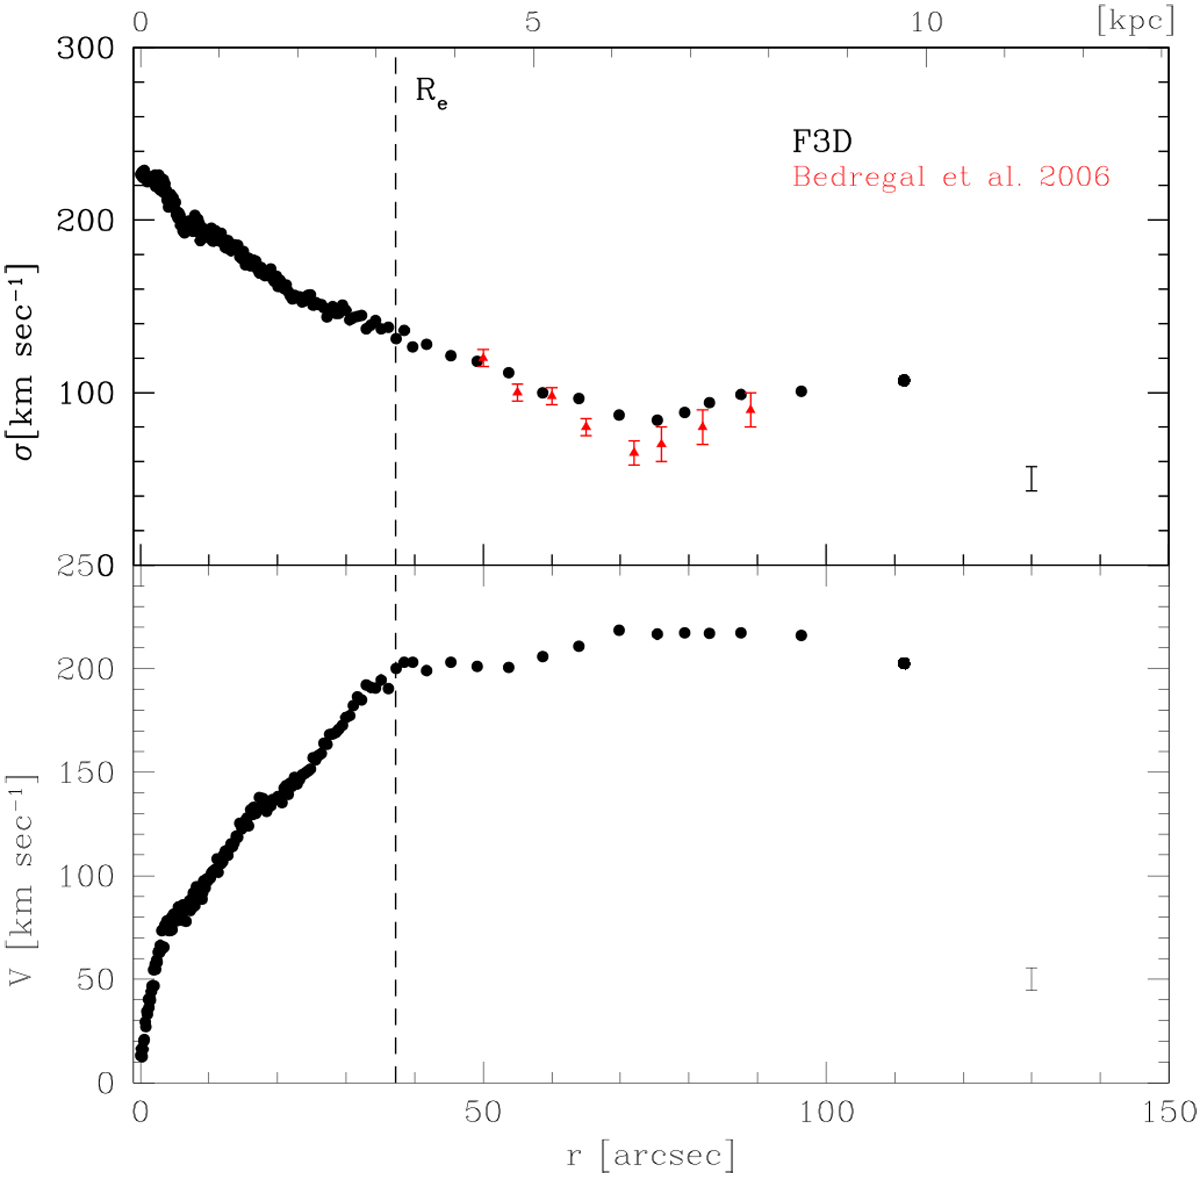
Stellar kinematics of FCC 167 extracted from the MUSE data (black points) at P.A. = 3.9° within the2 arcsec wide aperture crossing the nucleus shown in Fig. 4. The mean velocity v (bottom panel) and velocity dispersion σ (top panel) are given. The mean errors of the data are shown in the lower-right corner of each panel. The velocity dispersion is compared to the long-slit spectroscopic data obtained by Bedregal et al. (2006) for the north side of the galaxy (red points). The vertical dashed line corresponds to the effective radius.
Current usage metrics show cumulative count of Article Views (full-text article views including HTML views, PDF and ePub downloads, according to the available data) and Abstracts Views on Vision4Press platform.
Data correspond to usage on the plateform after 2015. The current usage metrics is available 48-96 hours after online publication and is updated daily on week days.
Initial download of the metrics may take a while.