Fig. 4
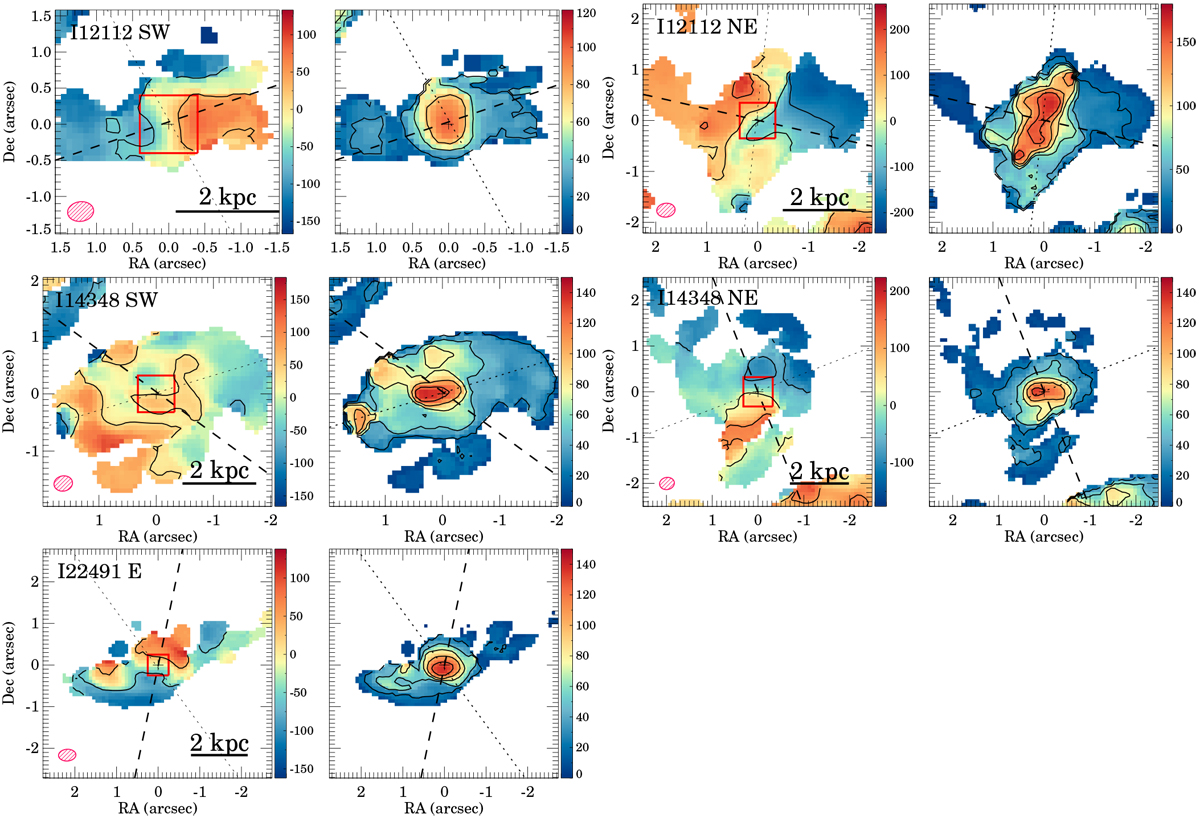
For each galaxy of the ULIRG systems, the left- and right-hand panels show the first and second moments of the CO(2–1) emission, respectively. The spacings between the contour levels in the first and second moment maps are 100 and 25 km s−1, respectively.For the first moment maps, the velocities are relative to the systemic velocity (see Table 1). The red box in this panel indicates the field of view presented in Fig. 5 for each object. The dashed and dotted lines mark the kinematic major axis and the outflow axis, respectively, defined in Sect. 3.2 (see also Fig. 5). The black cross marks the position of the 248 GHz continuum peak. The red hatched ellipse shows the beam FWHM and PA.
Current usage metrics show cumulative count of Article Views (full-text article views including HTML views, PDF and ePub downloads, according to the available data) and Abstracts Views on Vision4Press platform.
Data correspond to usage on the plateform after 2015. The current usage metrics is available 48-96 hours after online publication and is updated daily on week days.
Initial download of the metrics may take a while.