Fig. 12
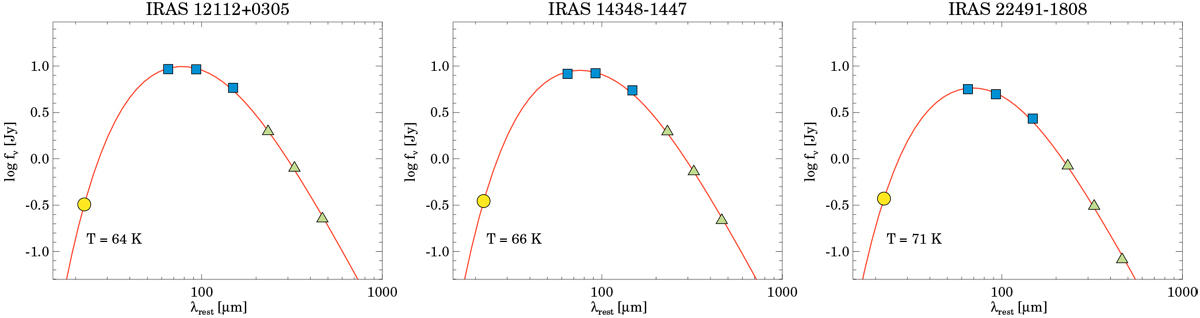
Mid- and far-IR spectral energy distribution of the three ULIRGs. The yellow circle corresponds to the Spitzer/MIPS 24 μm flux, the blue squares to the Herschel/PACS 60, 100, and 160 μm fluxes, and the green triangles to the Herschel/SPIRE 250, 350, and 500 μm fluxes. The solid red line is the best fit to the data using a single temperature gray body.
Current usage metrics show cumulative count of Article Views (full-text article views including HTML views, PDF and ePub downloads, according to the available data) and Abstracts Views on Vision4Press platform.
Data correspond to usage on the plateform after 2015. The current usage metrics is available 48-96 hours after online publication and is updated daily on week days.
Initial download of the metrics may take a while.