Fig. 1
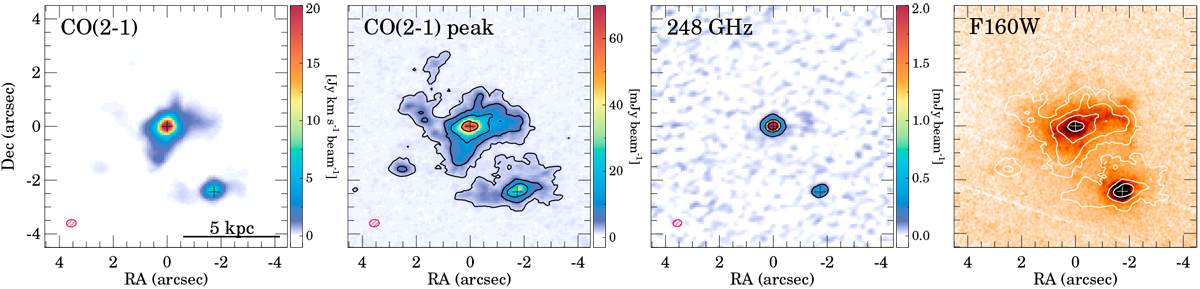
ALMA and HST maps for IRAS 12112+0305. The first and second panels are the CO(2–1) integrated flux and peak intensity for ~10 km s−1 channels, respectively. The contour levels in the second panel correspond to (6, 18, 54, 162, 484) × σ, where σ is the line sensitivity (Table 2). The third panel is the ALMA 248 GHz continuum. The contours in this panel are (3, 27, 81) × σ where σ is the continuum sensitivity (Table 2). The fourth panel shows the near-IR HST/NICMOS F160W map with the CO(2–1) peak contours. The position of the two nuclei is marked with a cross in all the panels. The red hatched ellipse represents the FWHM and PA of the ALMA beam (Table 2).
Current usage metrics show cumulative count of Article Views (full-text article views including HTML views, PDF and ePub downloads, according to the available data) and Abstracts Views on Vision4Press platform.
Data correspond to usage on the plateform after 2015. The current usage metrics is available 48-96 hours after online publication and is updated daily on week days.
Initial download of the metrics may take a while.