Fig. 4
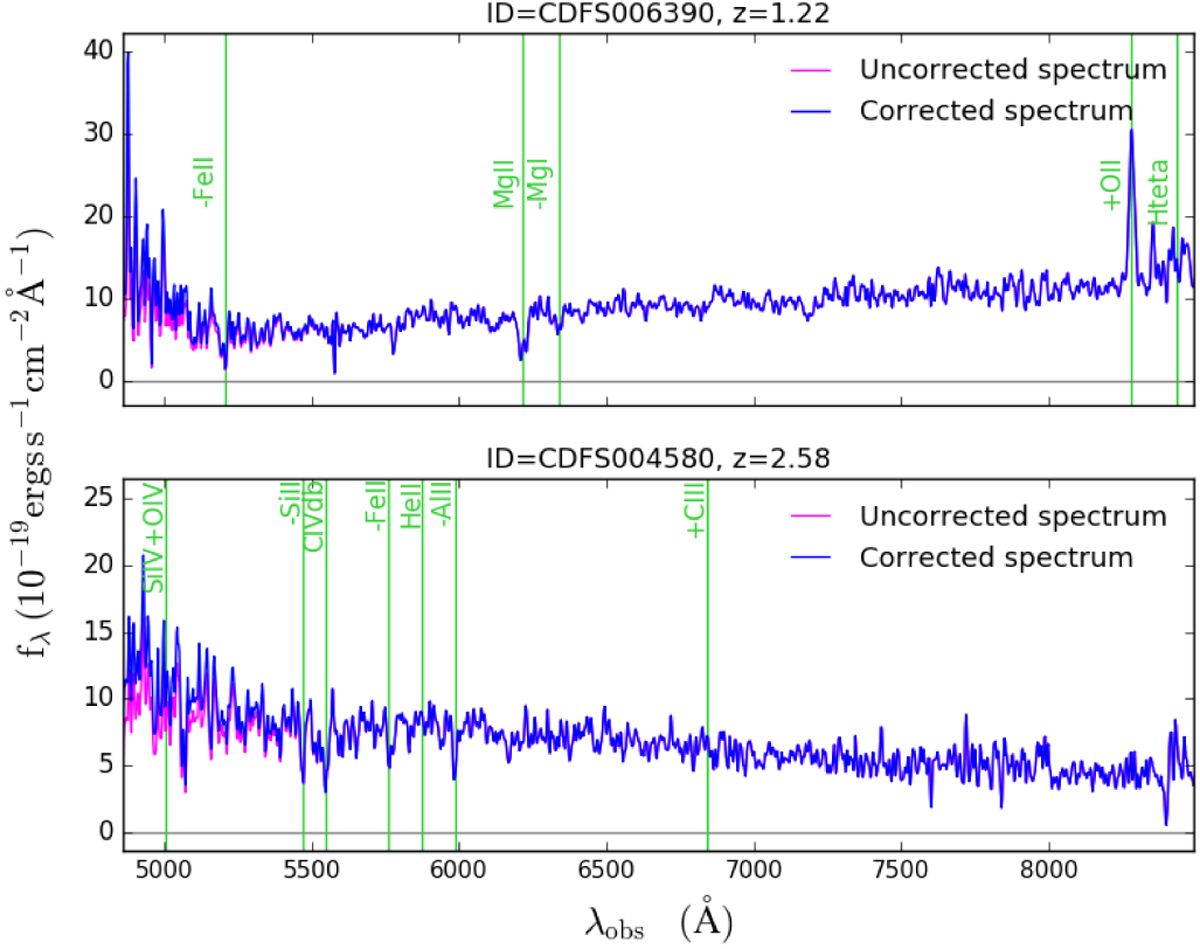
Effect of the blue flux correction: in blue, we show the final corrected spectrum, and in magenta, we plot the original flux-calibrated spectrum for CDFS006390 at z = 1.22 (top panel), which was selected in the PASS sample, and CDFS004580 at z = 2.58, which was selected in the SFG sample. We also indicate with green vertical lines the main spectral features we identified.
Current usage metrics show cumulative count of Article Views (full-text article views including HTML views, PDF and ePub downloads, according to the available data) and Abstracts Views on Vision4Press platform.
Data correspond to usage on the plateform after 2015. The current usage metrics is available 48-96 hours after online publication and is updated daily on week days.
Initial download of the metrics may take a while.