Free Access
Fig. 1
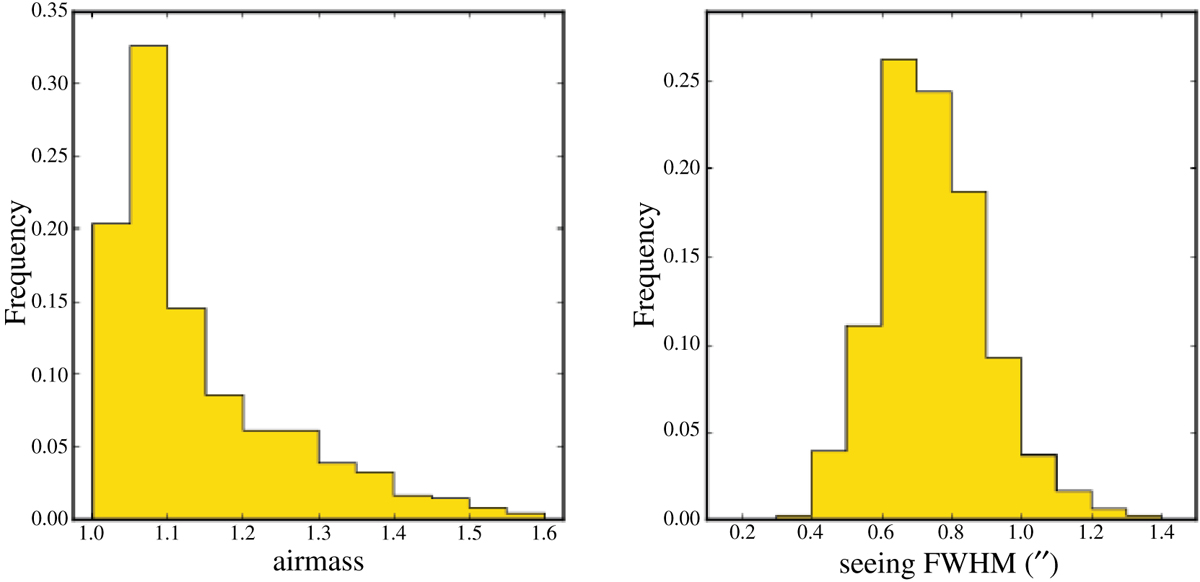
Observing conditions under which the data released in DR1 were obtained. Top panel: airmass of individual exposures, which is mostly constrained to below 1.5; bottom panel: seeing, measured directly on the spectra, which was mostly constrained to below 1′′.
Current usage metrics show cumulative count of Article Views (full-text article views including HTML views, PDF and ePub downloads, according to the available data) and Abstracts Views on Vision4Press platform.
Data correspond to usage on the plateform after 2015. The current usage metrics is available 48-96 hours after online publication and is updated daily on week days.
Initial download of the metrics may take a while.