Fig. 9
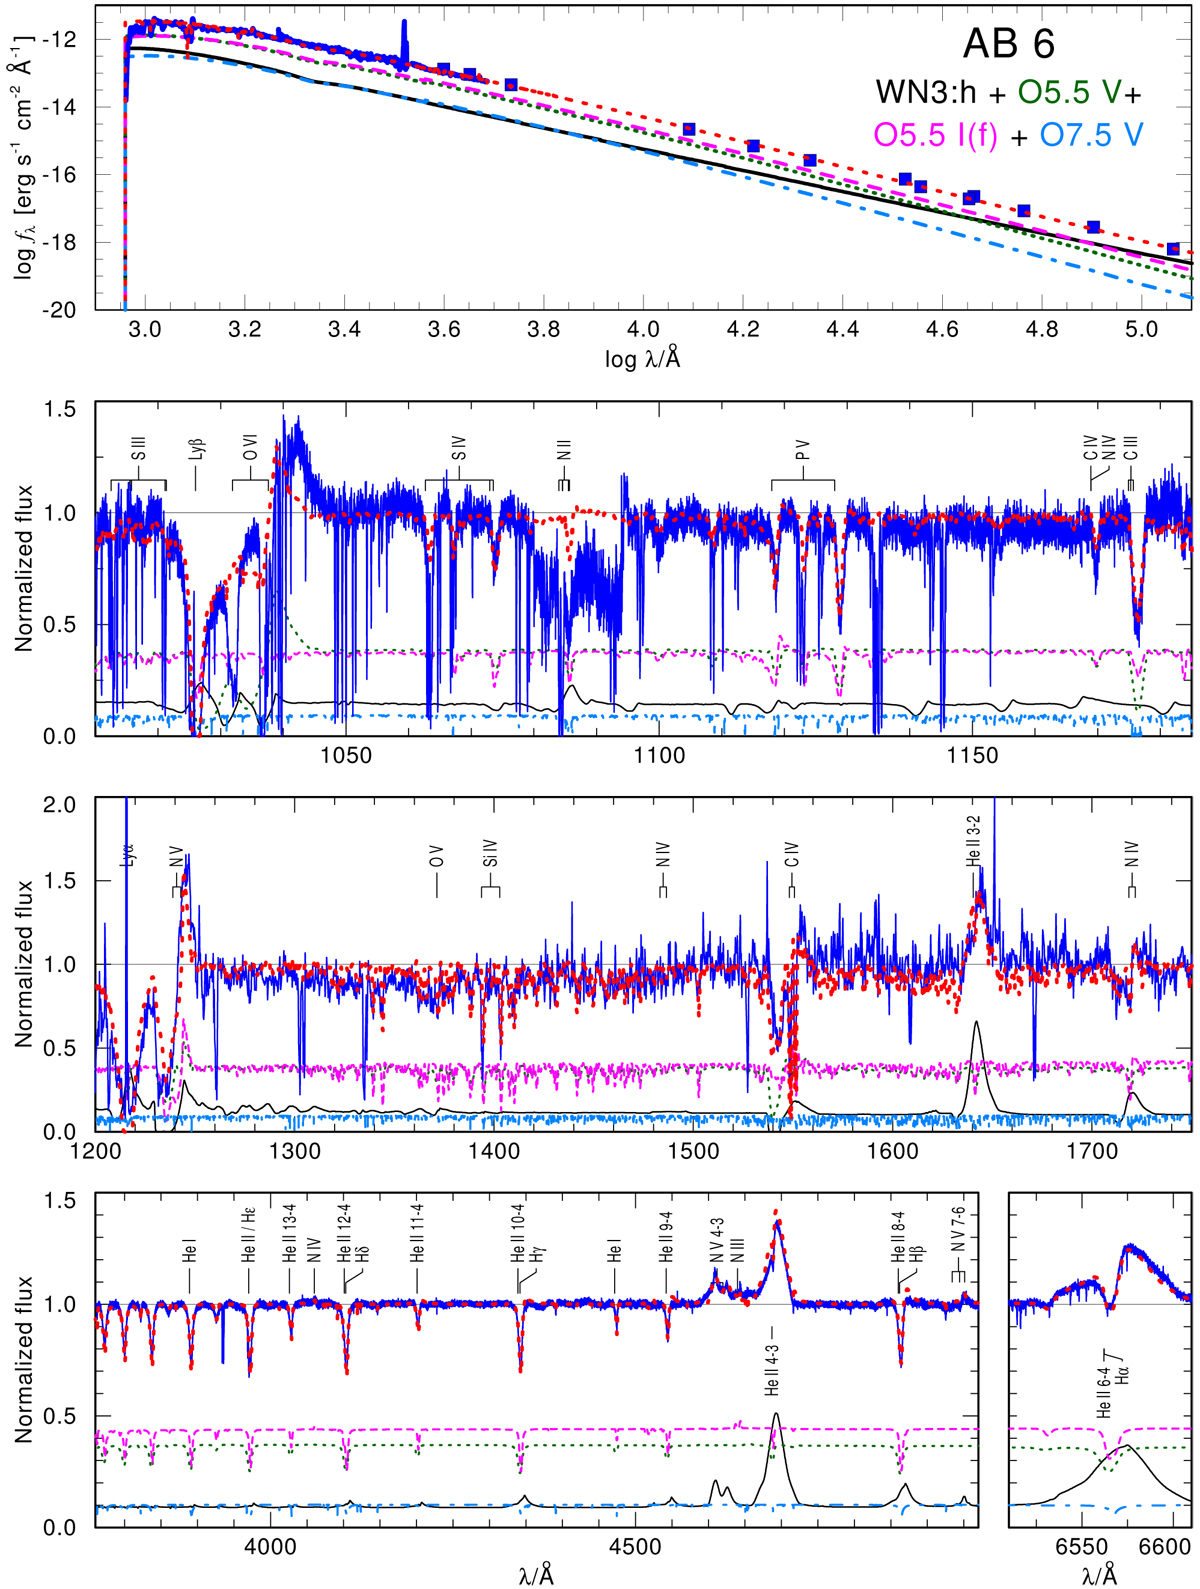
Upper panel: comparison between observed photometry and flux-calibrated IUE and FUSE spectra (blue squares and lines) with the best-fitting model SED of AB 6 (red dotted line), which is the sum of the reddened SEDs of stars A, B, C, and D (black solid, green dotted, pink dashed, and cyan dot-dashed lines). Lower panels: comparison between normalized FUSE, IUE, and UVES spectra at ϕ ≈ 0.1 and the best-fitting normalized spectrum of AB 6, comprising the weighted models of stars A, B, C, and D. Line styles are as in the upper panel.
Current usage metrics show cumulative count of Article Views (full-text article views including HTML views, PDF and ePub downloads, according to the available data) and Abstracts Views on Vision4Press platform.
Data correspond to usage on the plateform after 2015. The current usage metrics is available 48-96 hours after online publication and is updated daily on week days.
Initial download of the metrics may take a while.